

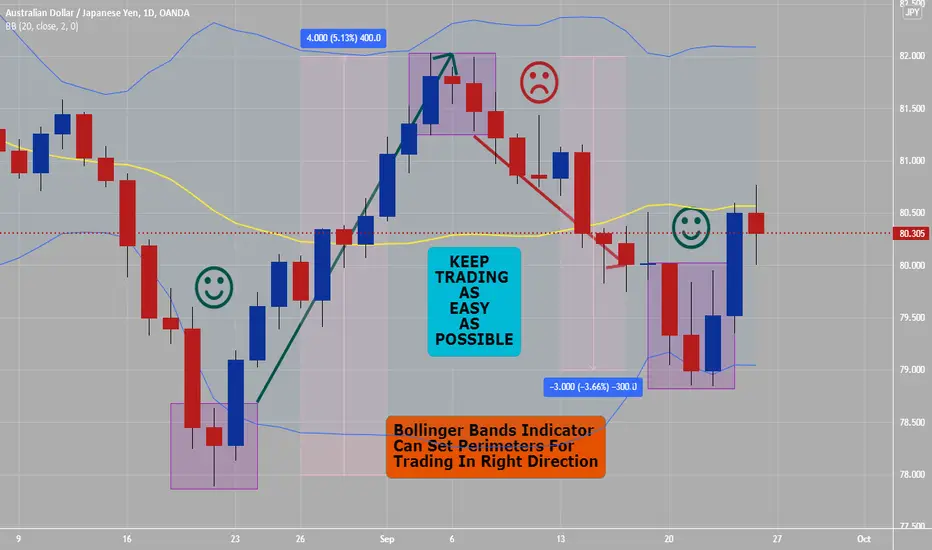
The Bollinger bands Indicator is a forex trading indicator.
This Bollinger bands Indicator can be used to find out the trading entries and the exits in the market trading.
This can be used with any type of currency pair. In market trading, the Bollinger bands indicator is used to identify price range levels.
The Bollinger bands indicator can be defined as a price letter that has both price upper and lower levels that generate better trade.
The standard deviation method is developed in this Bollinger bands indicator.
To calculate price levels, the Bollinger bands indicator uses two types of variables in the indicator chart.
The period and the standard deviation are the names of these variables.
The time period or time frames that this Bollinger bands indicator uses are called to as the period.
Enter and Exit when price action hits the outer edges of Bollinger bands and make a Engulfing, Harami or Pin-bar reversal candlestick pattern
This Bollinger bands Indicator can be used to find out the trading entries and the exits in the market trading.
This can be used with any type of currency pair. In market trading, the Bollinger bands indicator is used to identify price range levels.
The Bollinger bands indicator can be defined as a price letter that has both price upper and lower levels that generate better trade.
The standard deviation method is developed in this Bollinger bands indicator.
To calculate price levels, the Bollinger bands indicator uses two types of variables in the indicator chart.
The period and the standard deviation are the names of these variables.
The time period or time frames that this Bollinger bands indicator uses are called to as the period.
Enter and Exit when price action hits the outer edges of Bollinger bands and make a Engulfing, Harami or Pin-bar reversal candlestick pattern

免责声明
这些信息和出版物并非旨在提供,也不构成TradingView提供或认可的任何形式的财务、投资、交易或其他类型的建议或推荐。请阅读使用条款了解更多信息。