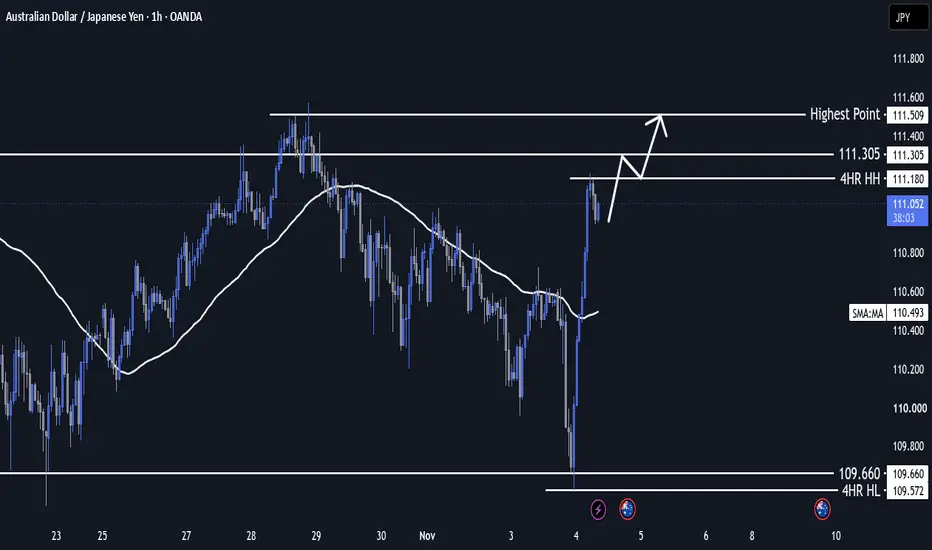
Australian Dollar / Japanese Yen
No trades
No trades
Peers for comparison
Pair info
This pair is the Australian Dollar against the Japanese Yen. In regards to U.S. equities on a short to medium term basis, it is often one of the most highly correlated pairs to price action. The pair tends to decline is a risk off approach and rise in a low risk environment on carry flows.
AUDJPY Trading Opportunity! BUY!
My dear friends,
AUDJPY looks like it will make a good move, and here are the details:
The market is trading on 110.31 pivot level.
Bias - Bullish
Technical Indicators: Supper Trend generates a clear long signal while Pivot Point HL is currently determining the overall Bullish trend of the ma
AUD/JPY BEST PLACE TO BUY FROM|LONG
Hello, Friends!
The BB lower band is nearby so AUD-JPY is in the oversold territory. Thus, despite the downtrend on the 1W timeframe I think that we will see a bullish reaction from the support line below and a move up towards the target at around 110.763.
Disclosure: I am part of Trade Nation'
Bullish bounce setup?AUD/JPY has bounced off the pivot and could rise toward the 1st resistance.
Pivot: 110.02
1st Support: 108.93
1st Resistance: 111.61
Disclaimer:
The opinions given above constitute general market commentary and do not constitute the opinion or advice of IC Markets or any form of personal or inve
Rising toward strong resistance?AUD/JPY has rejected ioff the pivot which is a pullback result and a cycle reverse toward the 1st support
Pivot: 111.38
1st Support: 109.88
1st Resistance: 112.51
Disclaimer:
The opinions given above constitute general market commentary and do not constitute the opinion or advice of IC Markets o
Bullish bounce in play?AUD/JPY has bounced off the support level, which is a pullback support and could potentially rise from this level to our take profit.
Entry: 111.06
Why we like it:
There is a pullback support level.
Stop loss: 109.86
Why we like it:
There is a pullback support.
Take profit: 112.46
Why we like it:
AUDJPY| Pressure Builds Before the MoveHi,
AUDJPY is bullish on the H1 timeframe, but buyers are struggling to push price higher within the 110.602–110.889 range due to selling pressure around the 111.041 level.
Buying pressure appears to be building within this range, with sellers struggling to absorb the bullish momentum. This create
AudJpy Trade IdeaWith AJ now flipping bullish on the 4hr and the hourly already being in sync, taking longs here makes the most sense. There is a high point price tapped into while being in a range. IF price breaks and retests the new 4hr and hourly high on the 5m then I'll be looking to get into longs with the high
AUDJPY — Bullish Structure | Momentum Conflict & Execution Wait# Bullish Structure | Momentum Conflict | Waiting for Alignment
**Higher-Timeframe Development**
Price mitigated the higher-timeframe structural auction order block (blue zone), establishing the foundation for the bullish directional development.
From there, intermediate structure confirmed its
See all ideas
Summarizing what the indicators are suggesting.
Oscillators
Neutral
Oscillators
Neutral
Summary
Neutral
Summary
Neutral
Summary
Neutral
Moving Averages
Neutral
Moving Averages
Neutral
Displays a symbol's price movements over previous years to identify recurring trends.
Frequently asked questions
Today, AUD/JPY rate is 108.764 JPY.
For broader market analysis, dive into the technicals on the AUDJPY live chart and read the latest AUDJPY news:
– Australia, NZ dollars extend gains as US Democratic sweep fuels risk rally
– Kiwi in brief skid after weak jobs data, Aussie pressured by dovish RBA turn
– Australian dollar slips as RBA hikes rates in a split decision
For broader market analysis, dive into the technicals on the AUDJPY live chart and read the latest AUDJPY news:
– Australia, NZ dollars extend gains as US Democratic sweep fuels risk rally
– Kiwi in brief skid after weak jobs data, Aussie pressured by dovish RBA turn
– Australian dollar slips as RBA hikes rates in a split decision
Markets don't sleep, here's what's going on with AUDJPY at the moment:
– Australia, NZ dollars extend gains as US Democratic sweep fuels risk rally
– Kiwi in brief skid after weak jobs data, Aussie pressured by dovish RBA turn
– Australian dollar slips as RBA hikes rates in a split decision
See more updates in real-time with our News Flow.
– Australia, NZ dollars extend gains as US Democratic sweep fuels risk rally
– Kiwi in brief skid after weak jobs data, Aussie pressured by dovish RBA turn
– Australian dollar slips as RBA hikes rates in a split decision
See more updates in real-time with our News Flow.
The safest way to trade AUDJPY is through a reliable broker. Create an account, fund it, and place a buy order.
You can trade AUDJPY directly from TradingView:
– Choose a broker: Explore our supported trading partners and pick one that fits your needs
– Compare options: View available brokers side by side to evaluate fees and features
– Connect your account: Open Supercharts, click "Trade", select your broker, and log in
– Start trading: Place orders without leaving the chart
Tip: If you're new to trading, try paper trading first — it lets you practice strategies in real market conditions without risking funds.
You can trade AUDJPY directly from TradingView:
– Choose a broker: Explore our supported trading partners and pick one that fits your needs
– Compare options: View available brokers side by side to evaluate fees and features
– Connect your account: Open Supercharts, click "Trade", select your broker, and log in
– Start trading: Place orders without leaving the chart
Tip: If you're new to trading, try paper trading first — it lets you practice strategies in real market conditions without risking funds.
It's worth checking AUDJPY rate change for various periods to get the full picture:
– 1 day — −0.38%
– 1 week — −1.77%
– 1 month — −1.40%
AUDJPY's all-time low was 55.074 JPY (Oct 24, 2008), and its highest price is 114.962 JPY (Aug 28, 2026). Track the dynamics with the latest forex news right on TradingView.
– 1 day — −0.38%
– 1 week — −1.77%
– 1 month — −1.40%
AUDJPY's all-time low was 55.074 JPY (Oct 24, 2008), and its highest price is 114.962 JPY (Aug 28, 2026). Track the dynamics with the latest forex news right on TradingView.
When trading AUDJPY, one should keep in mind many factors.
First, analyze the fundamentals:
– Macroeconomic data: Inflation, GDP, employment, and other key indicators in the economies behind both currencies
– Central bank policy: Interest rate decisions and monetary policy from the respective central banks
– Market sentiment: Check what other traders anticipate
– News flow: Geopolitical events and economic releases
Then check technical ratings:
– Today — strong sell
– 1-week — sell
– 1-month — buy
Identify the trend, watch key levels (support and resistance), consider volatility and upcoming economic events. Then, you'll be closer to an informed decision.
First, analyze the fundamentals:
– Macroeconomic data: Inflation, GDP, employment, and other key indicators in the economies behind both currencies
– Central bank policy: Interest rate decisions and monetary policy from the respective central banks
– Market sentiment: Check what other traders anticipate
– News flow: Geopolitical events and economic releases
Then check technical ratings:
– Today — strong sell
– 1-week — sell
– 1-month — buy
Identify the trend, watch key levels (support and resistance), consider volatility and upcoming economic events. Then, you'll be closer to an informed decision.
AUDJPY is a minor currency pair (also known as a cross pair), meaning it includes two major currencies but doesn't involve the US dollar.
What it means for traders:
– No USD exposure: Reflects the relative strength of two non-USD economies
– Lower liquidity than major pairs: Generally traded less than major currency pairs, but still widely available
– Potentially wider spreads: Trading costs may be higher than for major pairs
What to keep in mind about cross pairs:
– Region-focused moves: Often influenced by economic data and monetary policy in the two regions involved
– Direct currency comparison: Useful for comparing currencies without the influence of the US dollar
– Different volatility profile: May behave differently from major pairs, especially during regional events
Track rate movements on the AUDJPY chart and follow the latest forex news to stay informed.
What it means for traders:
– No USD exposure: Reflects the relative strength of two non-USD economies
– Lower liquidity than major pairs: Generally traded less than major currency pairs, but still widely available
– Potentially wider spreads: Trading costs may be higher than for major pairs
What to keep in mind about cross pairs:
– Region-focused moves: Often influenced by economic data and monetary policy in the two regions involved
– Direct currency comparison: Useful for comparing currencies without the influence of the US dollar
– Different volatility profile: May behave differently from major pairs, especially during regional events
Track rate movements on the AUDJPY chart and follow the latest forex news to stay informed.
AUDJPY volatility measures how much the exchange rate fluctuates over time, i.e. how quickly and how strongly it moves up or down.
The current volatility rating is 1.21%.
What it means for traders:
– Higher volatility: Larger and faster price swings → higher risk and opportunity
– Lower volatility: More stable price movement → smaller trading ranges
– Market behavior: Volatility often increases during major economic news or central bank decisions
Volatility helps traders estimate risk and position sizing. It's also useful for adapting strategies to market conditions.
How to use volatility:
– Compare volatility across other currency pairs
– Combine with technical analysis (trends, support/resistance)
– Monitor economic events that may increase market movement
The current volatility rating is 1.21%.
What it means for traders:
– Higher volatility: Larger and faster price swings → higher risk and opportunity
– Lower volatility: More stable price movement → smaller trading ranges
– Market behavior: Volatility often increases during major economic news or central bank decisions
Volatility helps traders estimate risk and position sizing. It's also useful for adapting strategies to market conditions.
How to use volatility:
– Compare volatility across other currency pairs
– Combine with technical analysis (trends, support/resistance)
– Monitor economic events that may increase market movement
AUDJPY is quoted as how many JPY (quote currency) it takes to buy one AUD (base currency).
For example, if the pair trades at 1.50, it means 1 AUD = 1.50 JPY.
What can influence the rate:
– Supply and demand: Driven by trade, investment flows, and speculation
– Economic data: Inflation, GDP, employment reports
– Central bank policy: Interest rates and monetary decisions
Follow these and more events in the Economic Calendar.
For example, if the pair trades at 1.50, it means 1 AUD = 1.50 JPY.
What can influence the rate:
– Supply and demand: Driven by trade, investment flows, and speculation
– Economic data: Inflation, GDP, employment reports
– Central bank policy: Interest rates and monetary decisions
Follow these and more events in the Economic Calendar.