
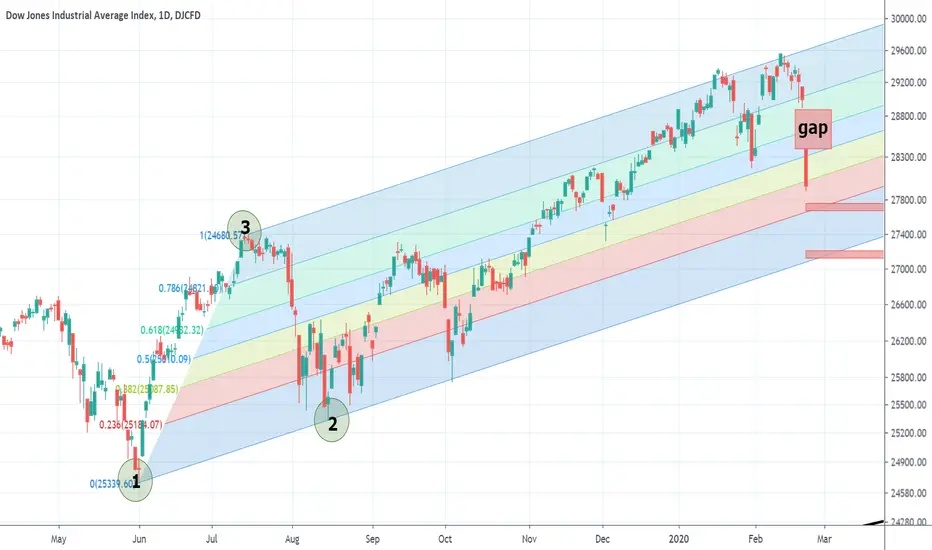
On the chart you can see the fibonacci channel obtained by combining two bottoms (pointed as 1 and 2 on the chart) and the peak between these two bottoms (pointed as 3). This channel should had been drawn and had been started to be followed just after 16th August,2019.
According to the interpretation of this fibonacci channel, it can be expected that dow jones will probably test the next channel line which is the bottom line of the red area in the fibonacci channel. This shows us approximately 27650. If it slides below this level, it can continue to fall toward 27110.
Something must be remembered: These dramatic falls in the indexes worldwide is mainly because of the news about Coronavirus (Covit-19). If the news about treatment comes into the scene, prices can rapidly rise again at least in order to fill up the gap shown on the chart.
According to the interpretation of this fibonacci channel, it can be expected that dow jones will probably test the next channel line which is the bottom line of the red area in the fibonacci channel. This shows us approximately 27650. If it slides below this level, it can continue to fall toward 27110.
Something must be remembered: These dramatic falls in the indexes worldwide is mainly because of the news about Coronavirus (Covit-19). If the news about treatment comes into the scene, prices can rapidly rise again at least in order to fill up the gap shown on the chart.

免责声明
这些信息和出版物并非旨在提供,也不构成TradingView提供或认可的任何形式的财务、投资、交易或其他类型的建议或推荐。请阅读使用条款了解更多信息。
免责声明
这些信息和出版物并非旨在提供,也不构成TradingView提供或认可的任何形式的财务、投资、交易或其他类型的建议或推荐。请阅读使用条款了解更多信息。