DOW JONES Correction far from over.Dow Jones (DJIA) has been trading within a Channel Up since the October 03 2022 market bottom. Its August 03 2026 All Time High (ATH) was a straight Higher High at the Top of the pattern's Sell Zone (Fibonacci 1.0 - 0.786 range).
The current pull-back is part of the Channel's latest Bearish Leg and
Dow Jones Industrial Average Index
No trades
No trades
Compare with Dow 30
Dow Jones Industrial Average market breadth
AdvancingDeclining
9 · 30%21 · 70%
Net advances
−12
A/D ratio
0.43
Up / down volume
226.3 M / 203.6 M
Index info
ISIN
US2605661048
CUSIP
260566104
FIGI
BBG000HZJJL8
Identifiers
ISIN US2605661048
Dow Jones* often refers to the Dow Jones Industrial Average, which was one of the first stock indices and is one of the most commonly referred to barometers of equity performance in the United States. The Dow Jones Industrial Average, not to be confused with the Dow Jones Transportation index (which was the first index), is often called, "the Dow" or "DJIA," and consists of thirty stocks which traditionally were industrial-based. But in recent years as the US economy has become more consumer-oriented, the index has seen a change in composition that no longer has much to do with direct industrial investment.
Weekly Technical Analysis - 2 November 2026
Wall Street's upward correction within the downtrend from the August high is losing momentum, with price rejected at the descending trendline from that high near the upper band and slipping back just below VWAP. The rising trendline from the May low sits below the lower band. RSI is around neu
Dow Jones — Downside Pressure Is Starting to BuildDow Jones is beginning to look a little heavier after its strong run earlier this month.
Price has now failed twice around the descending trendline, and the latest rejection near 52,400–52,600 is keeping buyers under pressure. The fact that Dow has slipped back below the Ichimoku area adds to that w
US30 | Bullish Scenario### US30 | Bullish Scenario
Price is showing bullish momentum and moving toward the buy-side liquidity above the previous highs.
It has also moved back above the breaker zone, weakening the previous bearish setup.
I will wait for price to reach the buy-side liquidity, then observe its reaction be
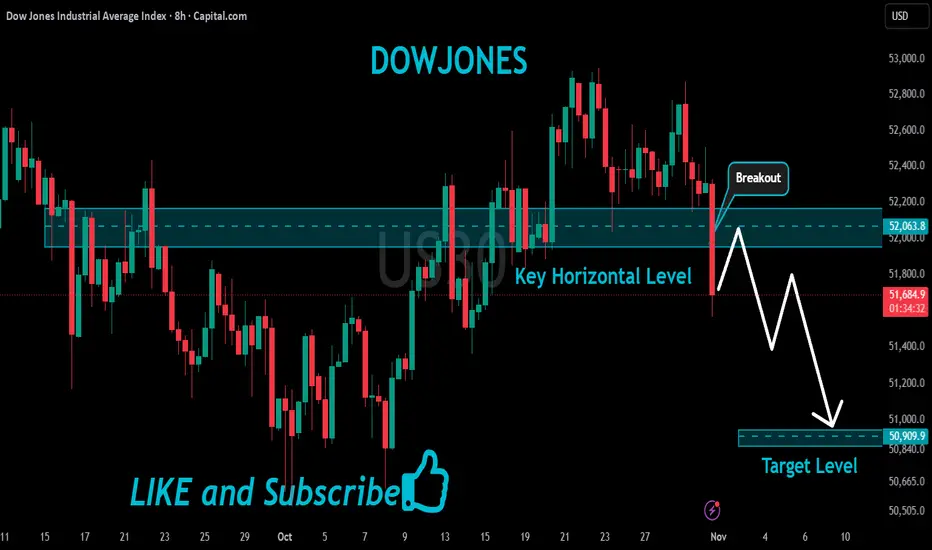
US30: bearish pressure at 52,150–52,200 supportUS30 | Capital.com CFD feed | 15-minute chart | October 29, 2026
Reference price during preparation: approximately 52,200.
US30 reversed sharply from the recent 52,850 area. The following rebounds failed to recover the lost ground, and the latest leg shows lower highs and renewed pressure on 52,150
Bullish bounce off?Dow Jones (US30) has bounced off the pivot, which acts as a pullback support and could rise toward the 1st resistance, which is an overlap resistance that is near the 61.8% Fibonacci retracement.
Pivot: 51,932.80
1st Support: 51,600.70
1st Resistance: 52,662.50
Disclaimer:
The opinions given abo
US30 - The UPTREND Still Has Room To RunUS30 is trading around 52,670, and the broader structure continues to favor the UPSIDE. Price remains firmly inside an Ascending Channel, while recent pullbacks have been absorbed without damaging the bullish structure. That tells me buyers are still controlling the market rather than simply reactin
US30 Is Going Up! Buy!
Please, check our technical outlook for US30.
Time Frame: 9h
Current Trend: Bullish
Sentiment: Oversold (based on 7-period RSI)
Forecast: Bullish
The price is testing a key support 51,763.0.
Current market trend & oversold RSI makes me think that buyers will push the price. I will anticipate a
Dow Jones H4 | Bullish Momentum BuildingThe price is falling to our buy entry level at 52,190.6, which is a pullback support.
Our stop loss is set at 51,544.9, which is an overlap support.
Our take profit is set at 53,691.9, which is a pullback resistance.
High Risk Investment Warning
65% of retail investor accounts lose money when tr
See all ideas
Summarizing what the indicators are suggesting.
Oscillators
Neutral
Oscillators
Neutral
Summary
Neutral
Summary
Neutral
Summary
Neutral
Moving Averages
Neutral
Moving Averages
Neutral
Displays a symbol's value movements over previous years to identify recurring trends.
Frequently asked questions
Today, Dow Jones Industrial Average Index is 51,786.72.
For broader market analysis, dive into the technicals on the Dow Jones Industrial Average Index live chart and read the latest Dow Jones Industrial Average Index news:
– Stocks wobble as investors watch US midterm elections
– U.S. Stocks Mixed Amid Midterm, Iran War Nerves — Update
– Nasdaq, S&P 500 Regain Ground But Dow Moves Back To The Downside
For broader market analysis, dive into the technicals on the Dow Jones Industrial Average Index live chart and read the latest Dow Jones Industrial Average Index news:
– Stocks wobble as investors watch US midterm elections
– U.S. Stocks Mixed Amid Midterm, Iran War Nerves — Update
– Nasdaq, S&P 500 Regain Ground But Dow Moves Back To The Downside
To put today's market move into context, compare the Dow Jones Industrial Average Index's performance across different time periods:
– 1 day — −0.38%
– 1 week — −0.94%
– 1 month — +1.06%
The Dow Jones Industrial Average Index's all-time low was 28.48 on Aug 8, 1896, while its all-time high was 54,744.33 on Aug 5, 2026.
Explore the Stock Heatmap and the Dow Jones Industrial Average Index live chart to see how the broader market is performing.
– 1 day — −0.38%
– 1 week — −0.94%
– 1 month — +1.06%
The Dow Jones Industrial Average Index's all-time low was 28.48 on Aug 8, 1896, while its all-time high was 54,744.33 on Aug 5, 2026.
Explore the Stock Heatmap and the Dow Jones Industrial Average Index live chart to see how the broader market is performing.
On the Dow Jones Industrial Average Index, the top performer over the past year is Merck & Co., Inc., with a gain of 68.68%.
Here's how it's been performing lately:
– Today — −2.49%
– 1 week — +3.17%
– 1 month — +0.63%
Remember:
– Performance can change quickly — today's leader may not stay on top
– High returns may come with higher volatility or risk
– Past performance doesn't guarantee future results
The best-performing component shows where momentum is strongest — but always look beyond returns to assess sustainability. Check out the Economic Calendar, Stock Heatmap, and other tools.
Here's how it's been performing lately:
– Today — −2.49%
– 1 week — +3.17%
– 1 month — +0.63%
Remember:
– Performance can change quickly — today's leader may not stay on top
– High returns may come with higher volatility or risk
– Past performance doesn't guarantee future results
The best-performing component shows where momentum is strongest — but always look beyond returns to assess sustainability. Check out the Economic Calendar, Stock Heatmap, and other tools.
The biggest companies in the Dow Jones Industrial Average Index include NVIDIA Corporation, Apple Inc., and Microsoft Corporation, with market capitalizations of approximately 4.98 T USD, 4.84 T USD, and 3.87 T USD.
The largest companies shape the direction of the Dow Jones Industrial Average Index — tracking them helps you understand what's moving the market.
What to check next:
– Growth and earnings: Are these companies still expanding?
– Valuation: Are they fairly priced relative to peers?
– Sector exposure: Is the index heavily weighted toward one industry?
Check these and more metrics in our Stock Screener and Heatmap.
The largest companies shape the direction of the Dow Jones Industrial Average Index — tracking them helps you understand what's moving the market.
What to check next:
– Growth and earnings: Are these companies still expanding?
– Valuation: Are they fairly priced relative to peers?
– Sector exposure: Is the index heavily weighted toward one industry?
Check these and more metrics in our Stock Screener and Heatmap.
The lowest recorded level of the Dow Jones Industrial Average Index is 28.48, reached on Aug 8, 1896.
It shows where the market hit its deepest decline — but combining it with highs, drawdowns, and long-term returns gives a fuller picture.
For more context, check other metrics too:
– All-time high — 54,744.33: Compare drawdowns and recovery strength
– Annual change — 8.57%: Average annual performance over time
– Technical rating — sell: Indicator-based signals (buy/sell/neutral) to assess current market momentum
It shows where the market hit its deepest decline — but combining it with highs, drawdowns, and long-term returns gives a fuller picture.
For more context, check other metrics too:
– All-time high — 54,744.33: Compare drawdowns and recovery strength
– Annual change — 8.57%: Average annual performance over time
– Technical rating — sell: Indicator-based signals (buy/sell/neutral) to assess current market momentum
The Dow Jones Industrial Average Index consists of 30 instruments, including stocks of companies such as NVIDIA Corporation, Apple Inc., Microsoft Corporation, and others.
Why index composition matters:
– Helps identify key players and trends within the index
– Used as a base for ETFs and index funds
– Useful for benchmarking individual assets
Index Dow Jones Industrial Average Index components show what drives the index's performance — exploring them helps uncover trends and opportunities.
Why index composition matters:
– Helps identify key players and trends within the index
– Used as a base for ETFs and index funds
– Useful for benchmarking individual assets
Index Dow Jones Industrial Average Index components show what drives the index's performance — exploring them helps uncover trends and opportunities.
On the Dow Jones Industrial Average Index, some of the highest-priced stocks include GS, CAT, and MSFT, trading at 896.09 USD, 623.94 USD, and 520.99 USD per share.
What it means:
– High share price ≠ higher value: Price per share doesn't reflect total company size (market cap does)
– No stock splits: Expensive stocks often haven't split their shares
– Lower accessibility: Higher prices may require larger capital per position
Knowing the most expensive components can be useful for traders who consider position sizing and capital allocation.
What to check next:
– Market cap: True measure of company size
– Valuation ratios (P/E, etc.): Whether the stock is expensive fundamentally
– Stock split history: May affect accessibility and price perception
You can follow these and more metrics in our Stock Screener.
What it means:
– High share price ≠ higher value: Price per share doesn't reflect total company size (market cap does)
– No stock splits: Expensive stocks often haven't split their shares
– Lower accessibility: Higher prices may require larger capital per position
Knowing the most expensive components can be useful for traders who consider position sizing and capital allocation.
What to check next:
– Market cap: True measure of company size
– Valuation ratios (P/E, etc.): Whether the stock is expensive fundamentally
– Stock split history: May affect accessibility and price perception
You can follow these and more metrics in our Stock Screener.
On the Dow Jones Industrial Average Index, the weakest performer right now is NIKE, Inc. Class B, down 40.54% over the past year.
Here's how it's been performing lately:
– Today — −1.64%
– 1 week — +1.77%
– 1 month — +18.21%
Remember:
– Weak performance can be temporary or cyclical
– Some laggards may become recovery or turnaround opportunities
– Past losses don't guarantee future declines
The worst-performing component highlights where the market sees the most weakness — but it can also signal potential opportunities if conditions improve. Check out the Economic Calendar, Stock Heatmap, and other tools to stay updated.
Here's how it's been performing lately:
– Today — −1.64%
– 1 week — +1.77%
– 1 month — +18.21%
Remember:
– Weak performance can be temporary or cyclical
– Some laggards may become recovery or turnaround opportunities
– Past losses don't guarantee future declines
The worst-performing component highlights where the market sees the most weakness — but it can also signal potential opportunities if conditions improve. Check out the Economic Calendar, Stock Heatmap, and other tools to stay updated.
The safest way to invest in Dow Jones Industrial Average Index is through a reliable broker. Create an account, fund it, and place a buy order for index futures or other derivatives.
You can trade Dow Jones Industrial Average Index directly from TradingView:
– Choose a broker: Explore our supported trading partners and pick one that fits your needs
– Compare options: View available brokers side by side to evaluate fees and features
– Connect your account: Open Supercharts, click "Trade", select your broker, and log in
– Start trading: Place orders without leaving the chart
Tip: If you're new to trading, try paper trading first — it lets you practice strategies in real market conditions without risking funds.
You can trade Dow Jones Industrial Average Index directly from TradingView:
– Choose a broker: Explore our supported trading partners and pick one that fits your needs
– Compare options: View available brokers side by side to evaluate fees and features
– Connect your account: Open Supercharts, click "Trade", select your broker, and log in
– Start trading: Place orders without leaving the chart
Tip: If you're new to trading, try paper trading first — it lets you practice strategies in real market conditions without risking funds.
The Dow Jones Industrial Average Index reached its all-time high of 54,744.33 on Aug 5, 2026.
All-time highs show where the market reached peak strength — but combining them with trends, valuations, and technical signals gives a clearer picture.
For more context, check other metrics too:
– All-time low — 28.48: Compare drawdowns and recovery strength
– Annual change — 8.57%: Average annual performance over time
– Technical rating — sell: Indicator-based signals (buy/sell/neutral) to assess current market momentum
All-time highs show where the market reached peak strength — but combining them with trends, valuations, and technical signals gives a clearer picture.
For more context, check other metrics too:
– All-time low — 28.48: Compare drawdowns and recovery strength
– Annual change — 8.57%: Average annual performance over time
– Technical rating — sell: Indicator-based signals (buy/sell/neutral) to assess current market momentum