
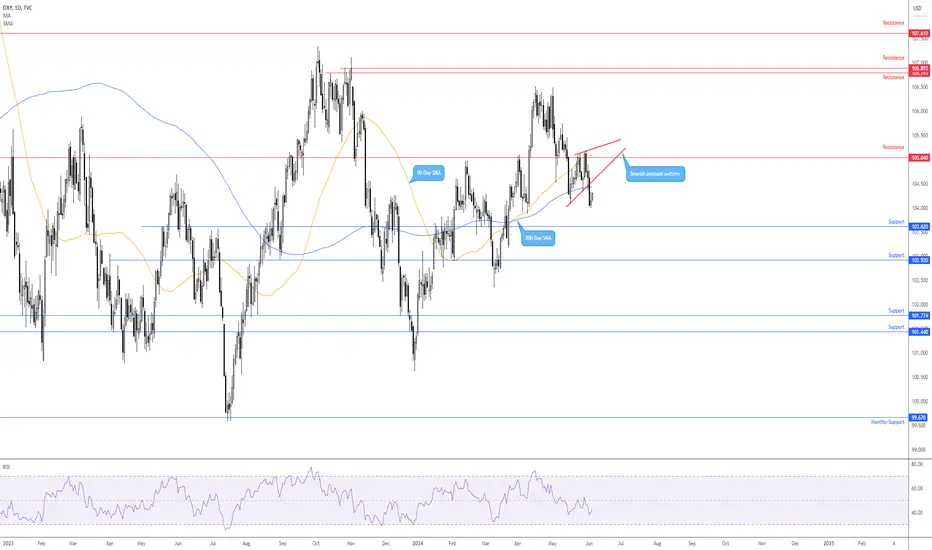
According to the US Dollar Index, the US dollar recently elbowed south of its 200-day simple moving average (SMA) at 104.43. This follows a rejection of resistance from 105.04 on the daily chart, which, as you can see, shares chart space with the 50-day SMA at 105.08.
Early Downtrend
Regarding trend studies, an early sign of a downtrend is seen through the handful of lower lows and lower highs formed after reaching a high of 106.52. Further supporting the downside bias is the Relative Strength Index (RSI) holding south of the 50.00 centreline (indicating average losses exceed average gains). Chart pattern enthusiasts may have also recognised the recently completed bearish pennant pattern, drawn from between 104.08 and 105.11.
Price Closing in on Retesting the Lower Side of Resistance
Although price action printed a moderate recovery yesterday, today’s movement shows price attempting to extend recovery gains. This could be sufficient to draw the Index back to the underside of the 200-day SMA and the lower boundary of the breached bearish pennant pattern’s structure, which may offer sellers enough resistance to fade.
So, with everything on show, bears still appear to be in the driving seat ahead of today’s US ADP non-farm employment change report and the US ISM services data.

免责声明
这些信息和出版物并非旨在提供,也不构成TradingView提供或认可的任何形式的财务、投资、交易或其他类型的建议或推荐。请阅读使用条款了解更多信息。
免责声明
这些信息和出版物并非旨在提供,也不构成TradingView提供或认可的任何形式的财务、投资、交易或其他类型的建议或推荐。请阅读使用条款了解更多信息。