 IREN— HIEQ Model
TQ Analysis | How High Could We Climax on This TS Map Now? 📈
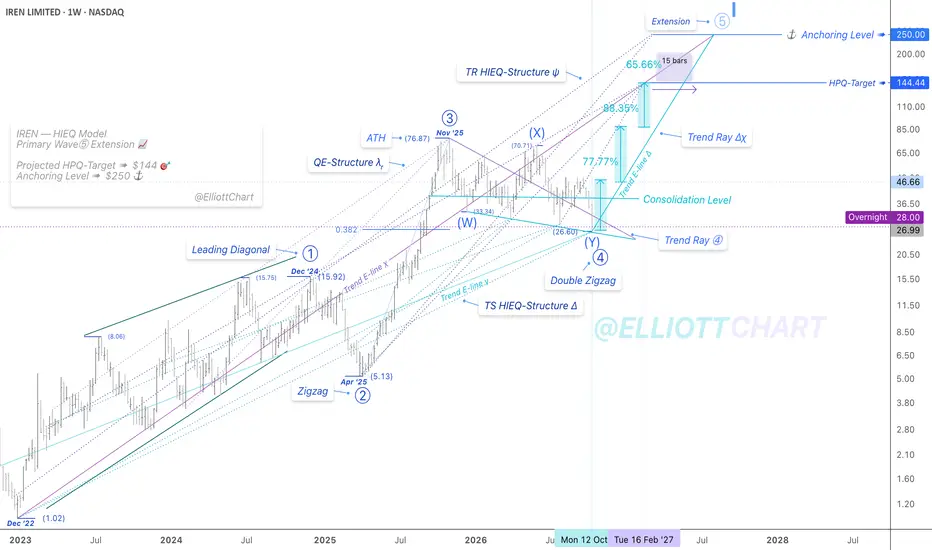
As illustrated on this weekly chart, I’ve refined the evolving HIEQ Model to reflect the recent price reaction, with the pullback now interacting with the Transition-Support Trend Ray ⓸ across the zone of convergence.
The consolidation phase of Primary Wave ⓸ has now unfolded into a Double Zigzag (W)–(X)–(Y), retracing toward the 0.382 Fibonacci level—a common retracement zone for fourth waves within an impulsive sequence.
As you may see on the chart, the Support E-line of the TS Trend Ray ⓸ has now preserved the price structure on four separate occasions, while the broader Cycle-degree Wave I trend remains under evaluation.
I’ve also shifted the Trend Ray Advance to a new timeline to reflect the evolving HIEQ Structures, while the HPQ Target ➤ $144 🎯 remains unchanged.
The projected Primary Wave ⓹ could potentially extend further, with the ultimate climax approaching the defined HP Anchoring Level ➤ $250 ⚓️.
🔖 HIEQ Model ➠ Highly Integrated & Entangling Quantum Model
#StrategicAnalysis #TrendAnalysis #MarketInfrastructures
#FutureVision #TimeSpaceMap #TSMap

免责声明
这些信息和出版物并非旨在提供,也不构成TradingView提供或认可的任何形式的财务、投资、交易或其他类型的建议或推荐。请阅读使用条款了解更多信息。