
Snap is an expensive growth stock. It’s the kind of name investors have mostly avoided this year, although recent weeks have seen a shift back to such companies.
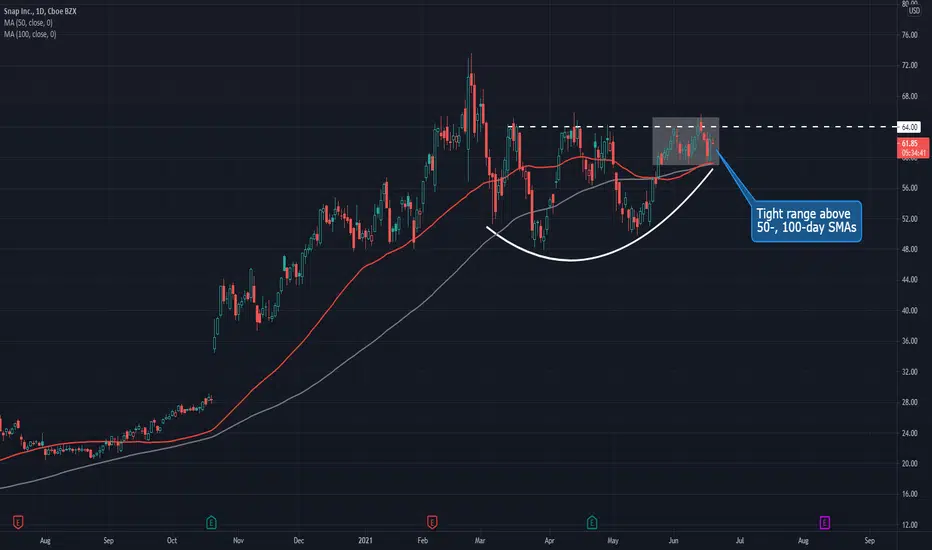
This chart highlights SNAP’s last four months of consolidation. It isn’t exactly a cup and handle, but there are important similarities: It’s a high basing pattern well above old highs. There’s no single punctuated drop but a gradual fading as momentum slows, followed by incrementally higher lows. The social-media stock is also forming a tight range on the right side, suggesting a breakout may be imminent.
The key line in the sand may be around $64. Prices have challenged that level several times on an intraday basis without a decisive close above it.
There’s also potential support to the downside, with SNAP holding its 50- and 100-day simple moving averages (SMAs).
TradeStation is a pioneer in the trading industry, providing access to stocks, options, futures and cryptocurrencies. See our Overview for more.

免责声明
这些信息和出版物并非旨在提供,也不构成TradingView提供或认可的任何形式的财务、投资、交易或其他类型的建议或推荐。请阅读使用条款了解更多信息。