
Technical Analysis and Outlook
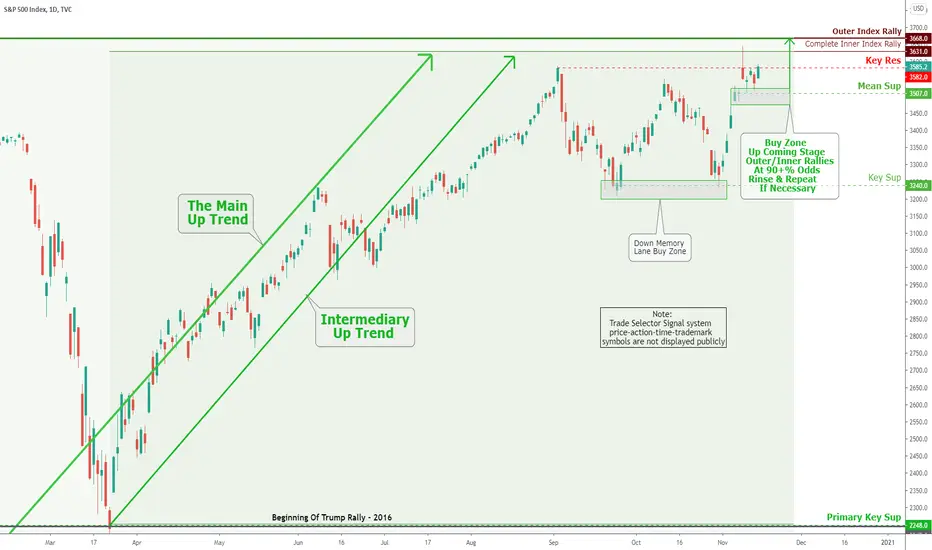
The S&P 500 bounced off the Key Res $3,582 and completed Inner Index Rally $3.631 projection on October 9th. The current ''Buy Zone'' and Mean Sup $3,507 stands as an excellent opportunity for buying once the prices drop this zone. To continue the rest of the market story, see the 'Weekly Market Review & Analysis For November 9, 2020" at the usual site.
The S&P 500 bounced off the Key Res $3,582 and completed Inner Index Rally $3.631 projection on October 9th. The current ''Buy Zone'' and Mean Sup $3,507 stands as an excellent opportunity for buying once the prices drop this zone. To continue the rest of the market story, see the 'Weekly Market Review & Analysis For November 9, 2020" at the usual site.

免责声明
这些信息和出版物并非旨在提供,也不构成TradingView提供或认可的任何形式的财务、投资、交易或其他类型的建议或推荐。请阅读使用条款了解更多信息。
免责声明
这些信息和出版物并非旨在提供,也不构成TradingView提供或认可的任何形式的财务、投资、交易或其他类型的建议或推荐。请阅读使用条款了解更多信息。