
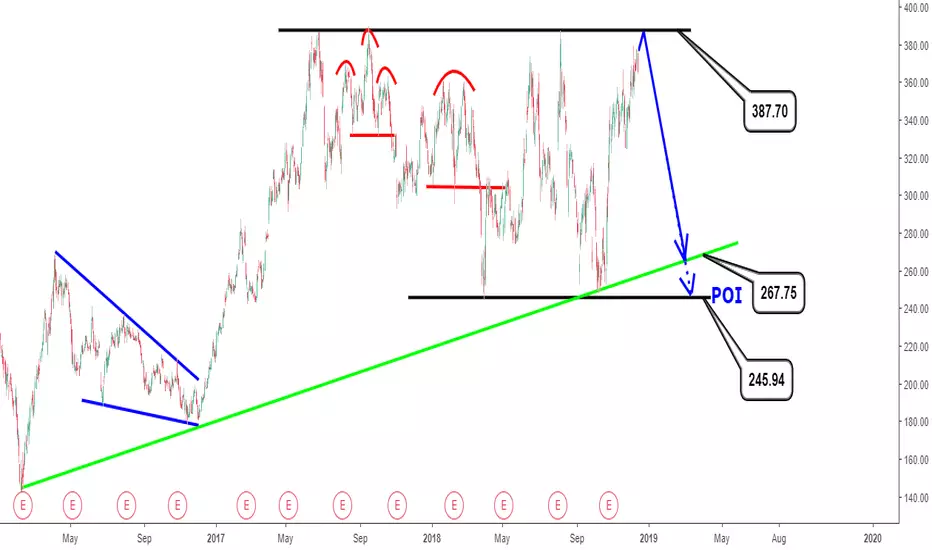
Tesla motors stock analysis (TSLA) for today is presented on a Daily timeframe that shows over 2 years of price action for the automotive and energy company.
June 27, 2017 to current date has seen Tesla’s stock price remain range bound between ~$387.70 and $246.55, with price currently trading near the top of the range and closing on Friday, December 14, 2018 at $365.71.
The range bound market since June 27, 2017 is identified in this Tesla analysis as a rectangle top pattern, which is ideally bearish.
Also important to keep in mind is the long term bullish trendline which is anticipated to provide support if bearish momentum picks up to the downside or the bottom of the range ($246.55) as mentioned above.
Point of invalidation (POI) of this analysis is price closing above the top of the current range. A consolidation of price after a breakout above the upper range of the rectangle would argue for further bullish bias in Tesla (TSLA), while a breakout alone could result in a bull trap = fake out breakout.
June 27, 2017 to current date has seen Tesla’s stock price remain range bound between ~$387.70 and $246.55, with price currently trading near the top of the range and closing on Friday, December 14, 2018 at $365.71.
The range bound market since June 27, 2017 is identified in this Tesla analysis as a rectangle top pattern, which is ideally bearish.
Also important to keep in mind is the long term bullish trendline which is anticipated to provide support if bearish momentum picks up to the downside or the bottom of the range ($246.55) as mentioned above.
Point of invalidation (POI) of this analysis is price closing above the top of the current range. A consolidation of price after a breakout above the upper range of the rectangle would argue for further bullish bias in Tesla (TSLA), while a breakout alone could result in a bull trap = fake out breakout.

相关出版物
免责声明
这些信息和出版物并非旨在提供,也不构成TradingView提供或认可的任何形式的财务、投资、交易或其他类型的建议或推荐。请阅读使用条款了解更多信息。