
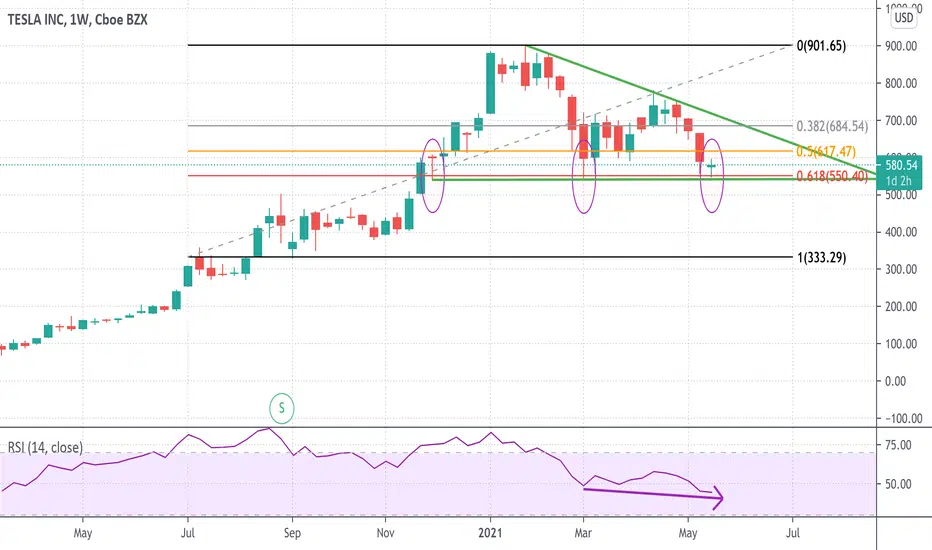
A weekly chart of TSLA will show us the longer term trend, which fate could be tested at the $550 level, which is coincidental with the 61.8% Fibonacci Retracement, a break below this level suggests the next target on the downside is $330 approximately.
There is a slight divergence with the RSI, when you take a look at the last bottom. (Bearish)
I will be keeping this on a close watch.
There is a slight divergence with the RSI, when you take a look at the last bottom. (Bearish)
I will be keeping this on a close watch.

免责声明
这些信息和出版物并非旨在提供,也不构成TradingView提供或认可的任何形式的财务、投资、交易或其他类型的建议或推荐。请阅读使用条款了解更多信息。
免责声明
这些信息和出版物并非旨在提供,也不构成TradingView提供或认可的任何形式的财务、投资、交易或其他类型的建议或推荐。请阅读使用条款了解更多信息。