
Hello Traders,
In this Elliott Wave Analysis, we will have a look at Tesla in the 1-hour timeframe.
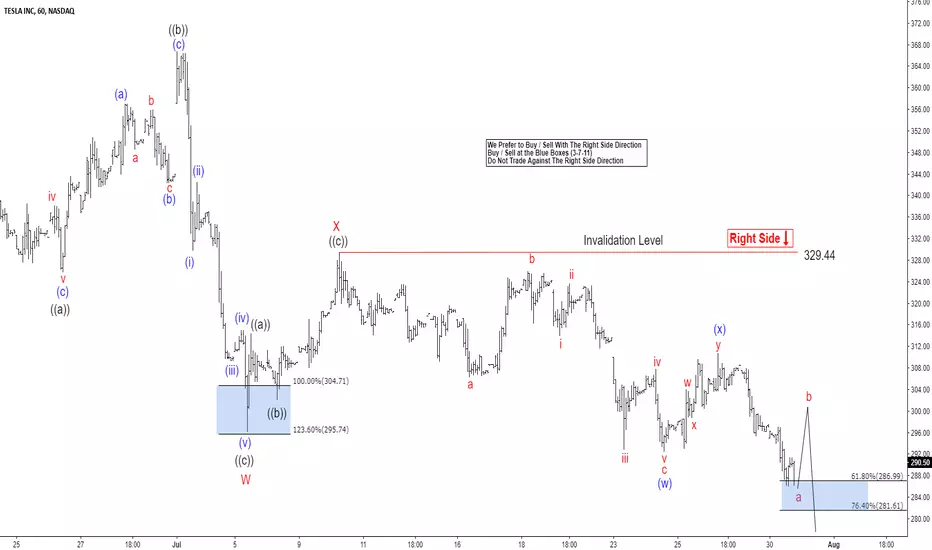
Tesla ended the cycle from 04/02/18 low (245.19) at the peak of 06/18/18 (373.85) in blue wave (1). Below from there, the stock is in the progress of correcting the cycle from 04/02/18 low in 3-7 or 11 swings lower in blue wave (2). The internals of blue wave (2) pullback is unfolding as an Elliott Wave double correction where red wave W ended at 07/05/18 low (296.05).
The internals of red wave W unfolded as a flat structure, where it ended black wave ((a)) at 06/26/18 (325.54), black wave ((b)) pullback at 07/02/18 peak (366.85) and black wave ((c)) of red wave W at 07/05/18 low (296). Up from there, it ended red wave X pullback at 07/10/18 peak (329.44). Below from that peak, it ended blue wave (w) at 07/24/18 low (292.35) and blue wave (x) pullback at 07/26/18 peak (310.63).
Near-term focus remains towards the area of 272.92-264.22, which is 100%-123.6% Fibonacci extension area of blue wave (w)-(x) before a reaction higher can be seen. As long as the pivot at 329.44 peak stays intact, we expect it to extend lower as the right side remains still to the downside.
In this Elliott Wave Analysis, we will have a look at Tesla in the 1-hour timeframe.
Tesla ended the cycle from 04/02/18 low (245.19) at the peak of 06/18/18 (373.85) in blue wave (1). Below from there, the stock is in the progress of correcting the cycle from 04/02/18 low in 3-7 or 11 swings lower in blue wave (2). The internals of blue wave (2) pullback is unfolding as an Elliott Wave double correction where red wave W ended at 07/05/18 low (296.05).
The internals of red wave W unfolded as a flat structure, where it ended black wave ((a)) at 06/26/18 (325.54), black wave ((b)) pullback at 07/02/18 peak (366.85) and black wave ((c)) of red wave W at 07/05/18 low (296). Up from there, it ended red wave X pullback at 07/10/18 peak (329.44). Below from that peak, it ended blue wave (w) at 07/24/18 low (292.35) and blue wave (x) pullback at 07/26/18 peak (310.63).
Near-term focus remains towards the area of 272.92-264.22, which is 100%-123.6% Fibonacci extension area of blue wave (w)-(x) before a reaction higher can be seen. As long as the pivot at 329.44 peak stays intact, we expect it to extend lower as the right side remains still to the downside.

14 days trial --> elliottwave-forecast.com/plan-trial/ and get Accurate & timely Elliott Wave Forecasts of 78 instruments. Webinars, Chat Room, Stocks/Forex/Indices Signals & more.
免责声明
这些信息和出版物并非旨在提供,也不构成TradingView提供或认可的任何形式的财务、投资、交易或其他类型的建议或推荐。请阅读使用条款了解更多信息。
14 days trial --> elliottwave-forecast.com/plan-trial/ and get Accurate & timely Elliott Wave Forecasts of 78 instruments. Webinars, Chat Room, Stocks/Forex/Indices Signals & more.
免责声明
这些信息和出版物并非旨在提供,也不构成TradingView提供或认可的任何形式的财务、投资、交易或其他类型的建议或推荐。请阅读使用条款了解更多信息。