
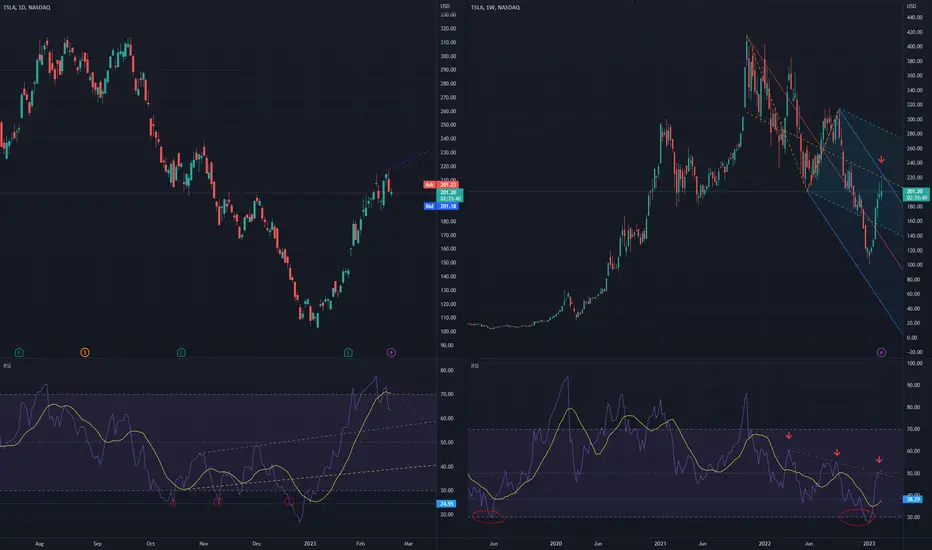
On weekly chart the price (almost) reached both the solid blue top pitchfork line and the middle orange pitchfork lines. Additionally, weekly RSI reached the dotted green resistance trendline. These are all bearish signs.
On daily chart, RSI has a bearish head-and-shoulders pattern and there is also a divergence between RSI (with purple trendline pointing downwards) and the PRICE (the purple trendline poingint upwards). Again, these are bearsih signs.
My previous TSLA idea was bullish and it went up 54% (from 137.80 to 212.11 when I gave the close signal), see related idea.
On daily chart, RSI has a bearish head-and-shoulders pattern and there is also a divergence between RSI (with purple trendline pointing downwards) and the PRICE (the purple trendline poingint upwards). Again, these are bearsih signs.
My previous TSLA idea was bullish and it went up 54% (from 137.80 to 212.11 when I gave the close signal), see related idea.
交易结束:到达目标
TSLA went down 16% (from 201.20 to 173.50). Now it seems ready to go up again, see related idea.
Join free discord.gg/wDTkRnS or t.me/TradersForecast
相关出版物
免责声明
这些信息和出版物并非旨在提供,也不构成TradingView提供或认可的任何形式的财务、投资、交易或其他类型的建议或推荐。请阅读使用条款了解更多信息。
Join free discord.gg/wDTkRnS or t.me/TradersForecast
相关出版物
免责声明
这些信息和出版物并非旨在提供,也不构成TradingView提供或认可的任何形式的财务、投资、交易或其他类型的建议或推荐。请阅读使用条款了解更多信息。