
Overview:
Tesla, Inc. (TSLA) is currently trading at approximately $395.47 on the daily chart, consolidating near a crucial inflection point. The market is weighing mixed macroeconomic cues against Tesla's ongoing evolution in artificial intelligence, autonomous driving, and energy storage solutions. Price action indicates that volatility compression is coming to an end, with buyers and sellers bracing for an impulsive directional move as the asset tests the apex of a prominent continuation pattern.
Fundamental / Macro Analysis:
From a macro and fundamental perspective, Tesla remains a bellwether for both consumer discretionary spending and high-growth technology valuation. With interest rate trajectories normalizing, the cost of capital for big-ticket purchases and corporate debt financing is stabilizing, supporting auto demand. Furthermore, fundamental value continues to be underpinned by the company's expanding energy generation and storage business segment, alongside monetization milestones in Full Self-Driving (FSD) software and artificial intelligence infrastructure. Valuation metrics remain forward-looking, heavily pricing in long-term autonomous ecosystem adoption over traditional automotive margins alone.
Technical Analysis & Price Action:
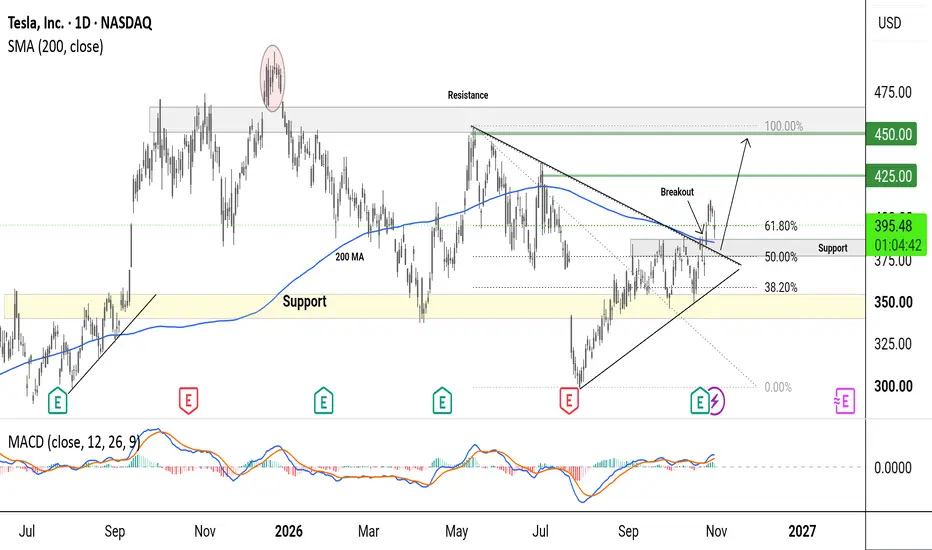
The daily chart reveals a well-defined symmetrical triangle pattern following the sharp recovery from the mid-year lows near the $320 zone.
Moving Averages: The price is interacting closely with the 200-day Simple Moving Average (SMA), which acts as a dynamic trend filter, confirming overall macro market structure alignment.
Fibonacci Retracement: Price is testing the 61.8% Golden Ratio (~$395.00), with key downside retracements at 50.0% (~$380.00) and 38.2% (~$360.00).
Momentum: The MACD (12, 26, 9) shows a narrowing histogram with lines compressing near the zero line, reflecting a temporary equilibrium in momentum right before a volatility expansion.
Price Action & Scenarios: The asset has triggered an initial upside probe/breakout from the upper descending trendline of the triangle pattern. A sustained daily close above immediate resistance will confirm bullish continuation toward higher supply zones. Conversely, a failure to hold current levels could trigger a retest of the ascending trendline support near $360–$370.
Key Levels to watch:
Immediate Support: $360.00 – $370.00 zone (Triangle lower trendline & local demand area)
Pivot / Breakout Level: $395.00 – $400.00 (Current consolidation and pattern apex resistance)
Upside Target 1: $425.00
Upside Target 2: $450.00 (Major overhead resistance band)
Major Resistance Ceiling: $480.00
Conclusion:
Tesla is sitting at a pivotal technical crossroads as momentum indicators coil for expansion. Market participants are closely monitoring whether bulls can convert the current triangle breakout into a sustained momentum rally toward the $425 and $450 resistance barriers, or if macroeconomic headwinds will force a deeper consolidation phase back toward pattern support.
Disclaimer: This analysis is for informational and educational purposes only and does not constitute financial, investment, or trading advice. Always conduct your own due diligence and risk management before executing any trades.
Tesla, Inc. (TSLA) is currently trading at approximately $395.47 on the daily chart, consolidating near a crucial inflection point. The market is weighing mixed macroeconomic cues against Tesla's ongoing evolution in artificial intelligence, autonomous driving, and energy storage solutions. Price action indicates that volatility compression is coming to an end, with buyers and sellers bracing for an impulsive directional move as the asset tests the apex of a prominent continuation pattern.
Fundamental / Macro Analysis:
From a macro and fundamental perspective, Tesla remains a bellwether for both consumer discretionary spending and high-growth technology valuation. With interest rate trajectories normalizing, the cost of capital for big-ticket purchases and corporate debt financing is stabilizing, supporting auto demand. Furthermore, fundamental value continues to be underpinned by the company's expanding energy generation and storage business segment, alongside monetization milestones in Full Self-Driving (FSD) software and artificial intelligence infrastructure. Valuation metrics remain forward-looking, heavily pricing in long-term autonomous ecosystem adoption over traditional automotive margins alone.
Technical Analysis & Price Action:
The daily chart reveals a well-defined symmetrical triangle pattern following the sharp recovery from the mid-year lows near the $320 zone.
Moving Averages: The price is interacting closely with the 200-day Simple Moving Average (SMA), which acts as a dynamic trend filter, confirming overall macro market structure alignment.
Fibonacci Retracement: Price is testing the 61.8% Golden Ratio (~$395.00), with key downside retracements at 50.0% (~$380.00) and 38.2% (~$360.00).
Momentum: The MACD (12, 26, 9) shows a narrowing histogram with lines compressing near the zero line, reflecting a temporary equilibrium in momentum right before a volatility expansion.
Price Action & Scenarios: The asset has triggered an initial upside probe/breakout from the upper descending trendline of the triangle pattern. A sustained daily close above immediate resistance will confirm bullish continuation toward higher supply zones. Conversely, a failure to hold current levels could trigger a retest of the ascending trendline support near $360–$370.
Key Levels to watch:
Immediate Support: $360.00 – $370.00 zone (Triangle lower trendline & local demand area)
Pivot / Breakout Level: $395.00 – $400.00 (Current consolidation and pattern apex resistance)
Upside Target 1: $425.00
Upside Target 2: $450.00 (Major overhead resistance band)
Major Resistance Ceiling: $480.00
Conclusion:
Tesla is sitting at a pivotal technical crossroads as momentum indicators coil for expansion. Market participants are closely monitoring whether bulls can convert the current triangle breakout into a sustained momentum rally toward the $425 and $450 resistance barriers, or if macroeconomic headwinds will force a deeper consolidation phase back toward pattern support.
Disclaimer: This analysis is for informational and educational purposes only and does not constitute financial, investment, or trading advice. Always conduct your own due diligence and risk management before executing any trades.

免责声明
这些信息和出版物并非旨在提供,也不构成TradingView提供或认可的任何形式的财务、投资、交易或其他类型的建议或推荐。请阅读使用条款了解更多信息。
免责声明
这些信息和出版物并非旨在提供,也不构成TradingView提供或认可的任何形式的财务、投资、交易或其他类型的建议或推荐。请阅读使用条款了解更多信息。