
Hello, traders.
Please "Follow" to get the latest information quickly.
Have a nice day today.
-------------------------------------
#TSLA
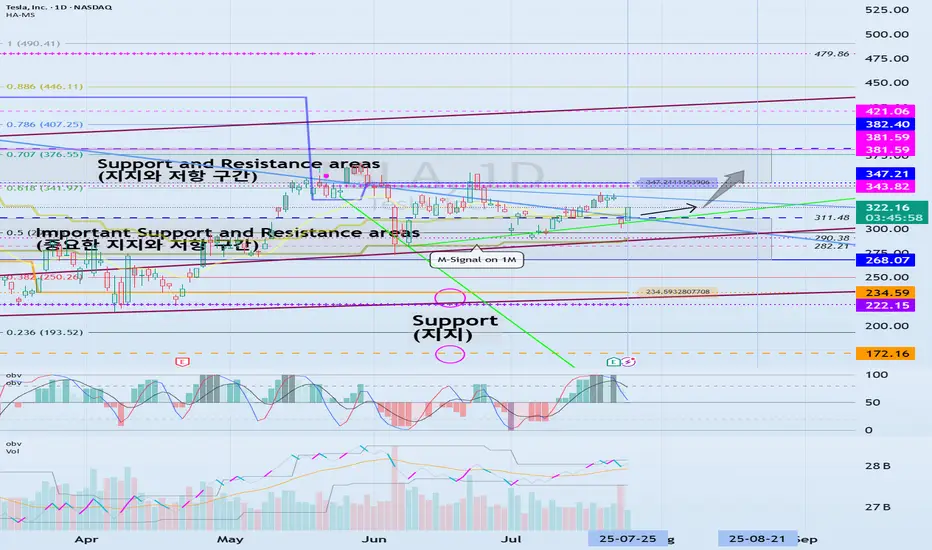
We need to see if it is rising along the rising channel.
The key is whether it can rise with support near 311.48 to break out of the downtrend line.
The key is whether it can rise along the short-term uptrend line and break through the short-term downtrend line after passing through this volatility period around July 25.
Therefore, we need to see whether it can rise above the 347.21-382.40 range with support near 311.48.
The next volatility period is expected to be around August 21.
-
The important thing is to maintain the price above the M-Signal indicator on the 1M chart.
If not, there is a possibility of a long-term downtrend.
Therefore, if it shows support in the 268.07-311.48 range, it is a time to buy.
-
Thank you for reading to the end.
I hope you have a successful trade.
--------------------------------------------------
交易开始
#TSLAIt appears to have broken out of the medium-term downtrend line (1).
However, it has not risen much from the important support and resistance area of 268.07-311.48. The key question is whether it can find support there and rise along the long-term uptrend line.
To create a new uptrend, it must rise above 382.40-521.06.
Therefore, we need to see if it can continue its upward trend along the long-term uptrend line.

[Practical trading strategy using HA-MS and SBOD]
youtu.be/aceN1AttX1Y
[Renko Bot]
readcrypto.kr/live
youtu.be/aceN1AttX1Y
[Renko Bot]
readcrypto.kr/live
免责声明
这些信息和出版物并非旨在提供,也不构成TradingView提供或认可的任何形式的财务、投资、交易或其他类型的建议或推荐。请阅读使用条款了解更多信息。
[Practical trading strategy using HA-MS and SBOD]
youtu.be/aceN1AttX1Y
[Renko Bot]
readcrypto.kr/live
youtu.be/aceN1AttX1Y
[Renko Bot]
readcrypto.kr/live
免责声明
这些信息和出版物并非旨在提供,也不构成TradingView提供或认可的任何形式的财务、投资、交易或其他类型的建议或推荐。请阅读使用条款了解更多信息。