 TSLA
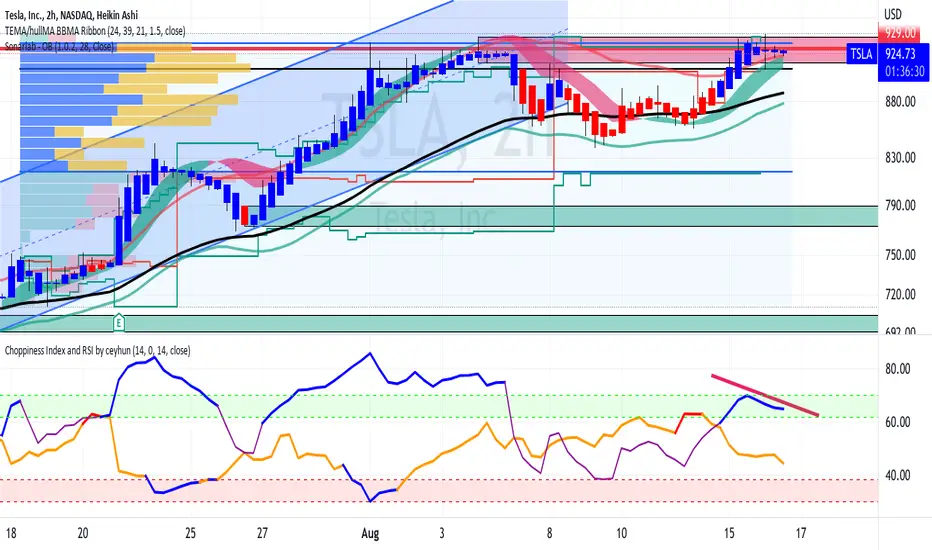
TSLATSLA has hit heavy resistance on the 2H chart as it
came up on the heavy sell order zone and the POC of the volume profile
TSLA reacted with Doji candles demonstrating buyer versus seller push and pull dynamics
The RSI is decreasing with a rise in price showing divergence and suggesting
TSLA is about to roll over. The Choppiness Indicator is still moderately elevated
showing buyer. seller action is sideways.
All in all, I forecast that TSLA is set up to short ( or via put options ) with targets
of 790 and 705. For a great reward-to-risk ratio, the stop loss can be $1.00 above
the top of the sell order zone.
Please review and offer your opinion in a comment !
( As an aside take a look at my idea of Sell Tesla Buy Ford using a TSLA / F ratio over
time as the key data for the analysis)

免责声明
这些信息和出版物并非旨在提供,也不构成TradingView提供或认可的任何形式的财务、投资、交易或其他类型的建议或推荐。请阅读使用条款了解更多信息。
免责声明
这些信息和出版物并非旨在提供,也不构成TradingView提供或认可的任何形式的财务、投资、交易或其他类型的建议或推荐。请阅读使用条款了解更多信息。