
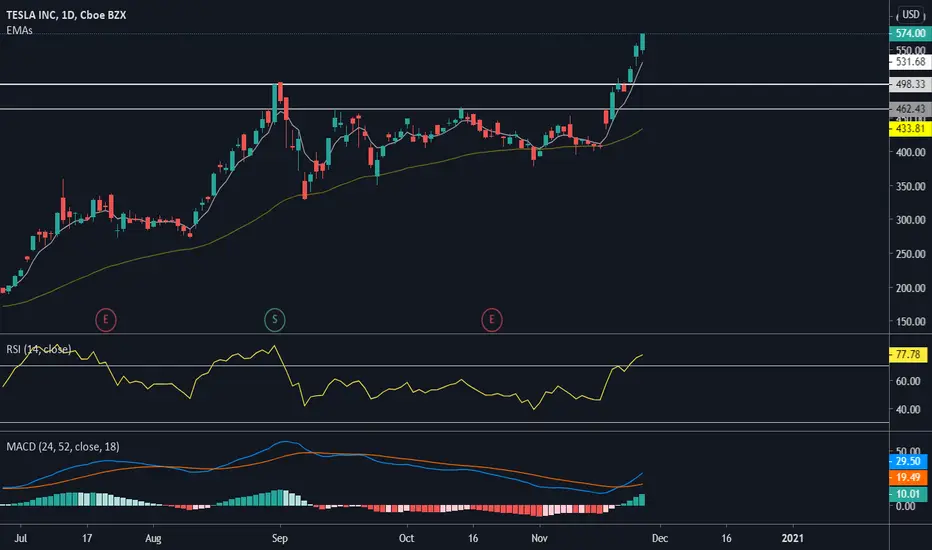
We are looking at a nice Day chart here, it's very appealing and dazzling. The latest bull run is exceptionally a nice rally with only a few ugly red candles. However, things' might not be as fine and dandily as you may (or may not) think. As diamonds are forever bull runs are not forever. On day chart RSI is gone above magical level (70), which usually indicates that the s**t is about to hit the fan soon, especially when this happens on a day chart. Lets take a closer look at 14/56 hour chart (15min chart for goofs).
注释
Here we have a handsome 14/56 chart that gives us further short-term information. As we manage to see the price has bounced a couple of times from the trendline that makes the trend even stronger. Concurrently the downward breakup shall also be more severe. Currently, I keep watching the trendline and moving averages. Fyi I use ema 5 and 50. This shall not be investing advice.
注释
Hola, Let's take a look at 5 minutes chart. Tesla reached new ATH soon after NASDAQ opening. However, soon after the opening, the price started to tumble and the stock couldn't make a new ATH anymore. Using lows and highs we can draw a triangle. RSI is still way over level 70 on the daily chart, which indicates there will be some more selling pressure during the next few days. RSI is showing a buy signal on the 5-minute chart (also soon on the 15-minute chart), which may lead to an upward breakup. If you are looking for short trades, you should concentrate on the triangle and look for short/long positions.注释

免责声明
这些信息和出版物并非旨在提供,也不构成TradingView提供或认可的任何形式的财务、投资、交易或其他类型的建议或推荐。请阅读使用条款了解更多信息。