Market Outlook Weekly
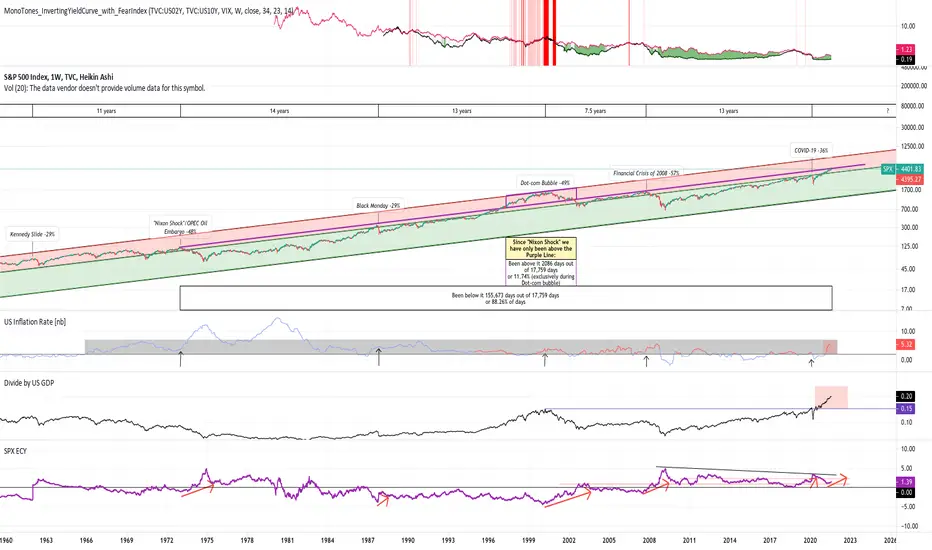
 SPX using a log chart I channeled the market since it's inception. The top of the channel (in red) is exclusively where the major stock market crashes have happened. The bottom channel (in green) is "crash free." The bold purple line is where 3 of last 4 market crashes have happened. Since the "Nixon Shock," SPX has failed to breach this line, except during the "dot-com bubble." U.S. inflation rates are rising, the Buffet Indicator (divide by US GDP on the chart) is at an all time high, and the CAPE (SPX ECY on chart) is starting to. rise, like it has at the top of every crash. However, a major crash has not when CAPE is above that black line, excluding COVID.
Note: Not claiming a crash now, just saying there are some warning signals and to be cautious.

免责声明
这些信息和出版物并非旨在提供,也不构成TradingView提供或认可的任何形式的财务、投资、交易或其他类型的建议或推荐。请阅读使用条款了解更多信息。
免责声明
这些信息和出版物并非旨在提供,也不构成TradingView提供或认可的任何形式的财务、投资、交易或其他类型的建议或推荐。请阅读使用条款了解更多信息。