Two zones to long the SPX500Hello Traders, there are 2 zones that you can enter market.
the first one is between 5980 and 5950. If it coincides with Bollinger lower band, it could go up more sharply.
in that case top of red bearish channel could be considered as the 1st tp.
The 2nd option available after breaking the top zone, in reverse to 6132 we could enter the market again. Remember that again Bollinger band could help us to confirm the long trade. 6240 could be used as TP, as well as the higher band of Bollinger ban
Bullish AB=CD
NFP Incoming - Will SPX Smash 6100?NFP Incoming – Will SPX Smash 6100? | SPX Market Analysis 7 Feb 2025
The bulls keep charging as SPX edges closer to 6100. But with the NFP report dropping pre-market, things could get lively.
Will we blast through resistance or bounce back down? Expect some whipsaw chaos before the market settles – but with a bullish trend already in play, we should at least get one more push toward target exits before the dust settles.
---
SPX Deeper Dive Analysis:
📈 Bullish Move On Track
SPX has ridde
(BTC) bitcoin "BB Trend - long range view"Here is another look at the BollingerBand Trend indicator with a greater reach in view. As seen in the graph with correlated indicator BTC reached a red zone at the time when the price was at its highest this year before falling and as the price fell the indicator began to rise once more. Being in a red, or under 0, with the BBTrend indicator right now and what does it mean is a good question to try to answer. There are too many indicators and all of them cannot be laid on top of one another to
ANTICIPATING TRADE Checked Dollar index(found bearish) versus major currencies and found JPY bullish, thus selected USDJPY for analysis, carried out analysis by applying following trading strategy:-
1. Bearish trend
2.Bullish divergence
3. No continuation pattern
4. No reversal pattern
5. Found bullish ab=cd harmonics pattern
6. Found trend reversal starting near point D THE PRZ, anticipates start of Bullish pattern and initiated two trades through buy stop
ANTICIPATING TRADES BY APPLYING TRADING STRETEGYAnalysis of AUDUSD Forex pair carried out on 12 Sep 2024 by applying following trade strategy:-
1. Bullish trend started and first HH formed
2. Bullish Divergence on end of Bearish trend
3. No continuation pattern
4. Bullish Double Bottom reversal pattern formed
5. Bullish Harmonics pattern AB=CD pattern formed and chart near point D, PRZ
6. Anticipated that chart will go bullish by making HHs & HLs
7. Initiated two trades on MT4 by marking buy stop on first HH and stop loss at HL
ANTICIPATING TRADES BY APPLYING TRADING STRETEGYAnalysis of NZDUSD Forex pair carried out on 12 Sep 2024 by applying following trade strategy:-
1. Bearish trend
2. Bullish Divergence
3. No continuation pattern
4. Inverse Head & Shoulder reversal pattern formed
5. Bullish Harmonics pattern AB=CD pattern formed and chart near point D, PRZ
6. Anticipated that chart will go bullish by making HHs & HLs
7. Initiated two trades on MT4 by marking buy stop ON break out of inverse H & S neckline and stop loss at HL
ANTICIPATING TRADES BY APPLYING TRADING STRETEGYAnalysis of GBPUSD Forex pair carried out on 12 Sep 2024 by applying following trade strategy:-
1. Bearish trend
2. Bullish Divergence
3. No continuation pattern
4. Double Bottom reversal pattern formed
5. Bullish Harmonics pattern AB=CD pattern formed and chart near point D, PRZ
6. Anticipated that chart will go bullish by making HHs & HLs
7. Initiated two trades on MT4 by marking buy stop on break out of LH and stop loss at LL as no HL is still formed
ANTICIPATING TRADES BY APPLYING TADING STRETEGYAnalysis of EURUSD Forex pair carried out on 12 Sep 2024 by applying following trade strategy:-
1. Bearish trend
2. Bullish Divergence
3. No continuation pattern
4. Double Bottom reversal pattern formed
5. Bullish Harmonics pattern AB=CD pattern formed and chart near point D, PRZ
6. Anticipated that chart will go bullish by making HHs & HLs
7. Initiated two trades on MT4 by marking buy stop on first HH and stop loss at LL as no HL is still formed
5ADR - Average Range of Last 5 CandlesticksAverage Daily Range (ADR) Indicator for the Last 5 Days
This script calculates the Average Daily Range (ADR) for the last 5 trading days. It helps traders to understand the average movement in pips, providing insights into potential price movements.
How to Use:
Set Chart to Daily Timeframe : Ensure your chart is set to the daily timeframe.
Hover Over Previous Day : To see the ADR for today, hover your mouse over the previous trading day.
For example, if today is Tuesday, hover over Mond
Indicator
Divergence into a Reversal?? - AUHere I have AUD/USD on the 1Hr Chart!
Our two current Lows @ ( .9498 ) on Wed. April 10th and ( .9456 ) on Fri. April 12th show an interesting underlying story when it comes to our indicators!
1) Looking to the RSI and comparing the Lows to Price on the chart, we can see that the RSI is showing a STRONG Divergence meaning Price could potentially be looking to move up now!
2) Our Momentum & Volatility indicators are showing Consolidation or Sideways movement meaning there is really no more tre
EURUSD Update: Shorting Opportunity IdentifiedTrade Setup:
- Entry: Sell at 1.0797 (Retest Level)
- Target: Extended towards potential Bullish Harmonic Patterns setup
- Risk Management: Implementing trade management system for upsized trades
Analysis:
While many analysts are focused on the potential Bullish Butterfly Pattern and ABCD Pattern on the 4-hourly chart, my attention is on a shorting opportunity using a trade management system. I'm looking to short EURUSD upon another retest at 1.0797, aiming to extend my targets towards po
Technical Analysis & Trading StrategiesIn the upcoming week, the spotlight might be on NZDJPY, particularly for those who lean towards structure-based trading methods.
In this scenario, we marry technical analysis with the art of trading.
Observations:
A keen eye at the support level reveals an ABCD pattern checkback on the 4-hourly chart, situated at 86.84.
For Fib-3 Bat enthusiasts, a buying opportunity may materialize on the 1-hourly chart.
Now, the pivotal question: What would be your approach to NZDJPY? Your insigh
How not to trade Gold. Really.Double Top preceded by a 50% Fibonacci was a bad trade idea. Lost 1K on this for trying someone else idea. Also lifted the SL to 1779-1782 area to act as the biggest risk I would take in this position. Even thought I knew the risks. I normally do not trade Gold since I do not have enough money. I could have taken gains at 1770 instead 📞 I'm such a noob.
Counter-Trend Trading OpportunityEURUSD is currently experiencing a bearish trend, but for those who are counter-trend traders, there may be an opportunity to buy at the AB=CD pattern completion at 1.0602.
It is important to wait for confirmation from a magic candle confirmation before executing this strategy.
The initial stop-loss should be set at 1.0562 (-40pips) or -400 USD/lot.
Our first target should be set at 1.0668(+66pips) or +660 USD/lot.
Before making any trades, it's critical to do your own analysis and follow
Long-Haul Profits vs In-and-Out Action!Are you the kind of trader who savors holding on for massive profits or one who dives into every market movement? 🚀
Let's explore this week's expert-level market analysis, where we have both these trading setups on display. Today, let's delve into the low-risk, high-return approach.
Turning our focus to the Australia-Canada pair, the weekly chart presents a compelling opportunity. Market proximity to the prior support zone ignites the interest of counter-trend traders like me, on the hunt for
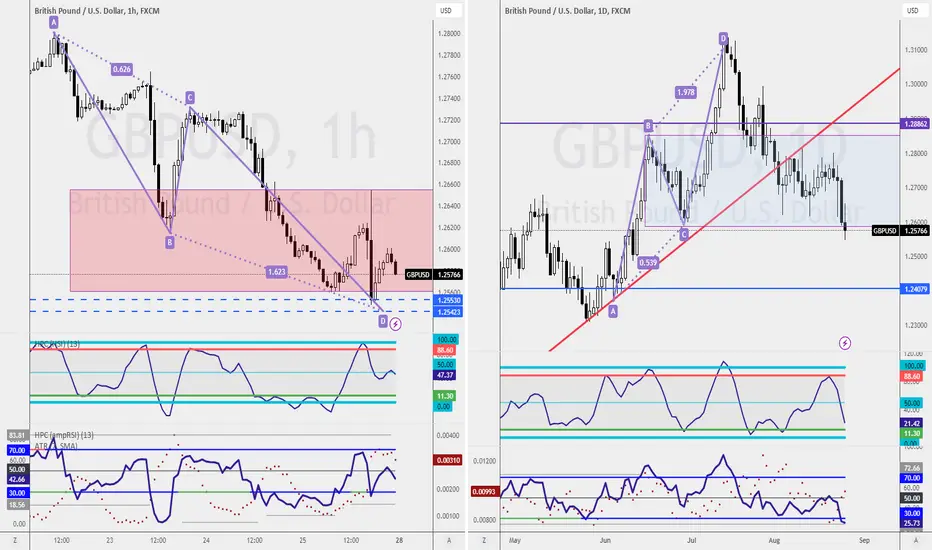
Pound-Dollar: Bearish SentimentsHey traders! 🌟 Despite the ongoing bullish trend in the pound-dollar realm, I'm sensing a change in the wind, and here's why I'm turning my attention towards a bearish shorting opportunity. Let's break it down.
On the weekly chart, the bullish vibes are strong within our buy zone. But wait, when we shift to the daily chart, we spot a sneaky closing below that initial support at 1.2592. 📉
While it's not a full-on bearish alarm, it's giving us room to explore an aggressive short approach.
Zoom
Immediate Trading OpportunitiesAustralian Dollar
Starting with the weekly chart, consolidation is evident. On the daily chart, a retest of the previous support within the consolidation. A four-hour chart shows an RSI divergence—a gem for counter-trend traders. The one-hour chart mirrors this setup. Reading trend movements with precise filters is pivotal to distinguishing buying from selling opportunities.
🔍 Weekly Chart Insights 🔍
A Gartley pattern is brewing at 61.67 on the weekly chart—a potential buying level. Transitioni
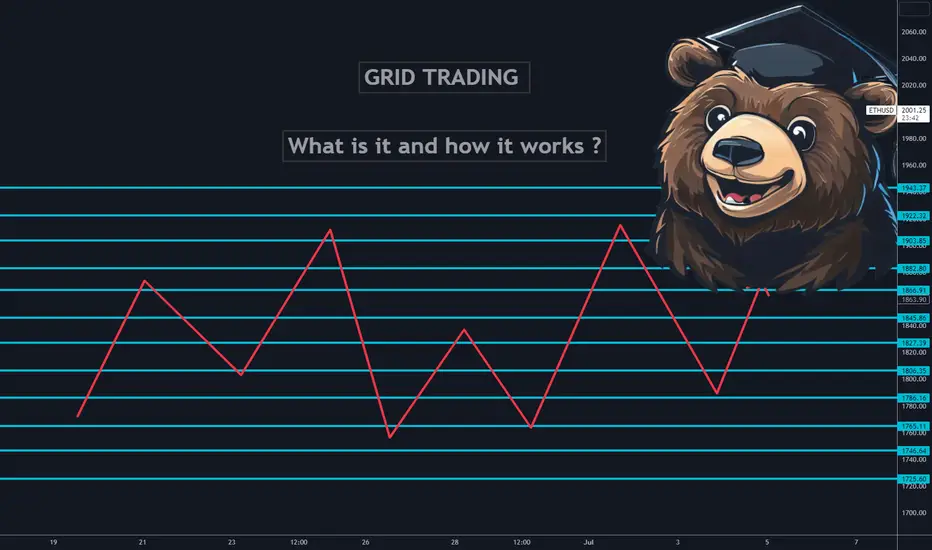
Educational: Grid Trading, What is it? How it works?Grid trading is often marketed as a way to win every trade. People usually get away with this type of marketing of the trading style due to the fact that grid trading does not care for market execution in the sense of market direction because you will close profitable trades if the market goes up or down. But it's not as simple as that.
What is Grid trading?
Grid trading is a type of trading strategy that makes use of market price variations by placing buy and sell orders at regular inte
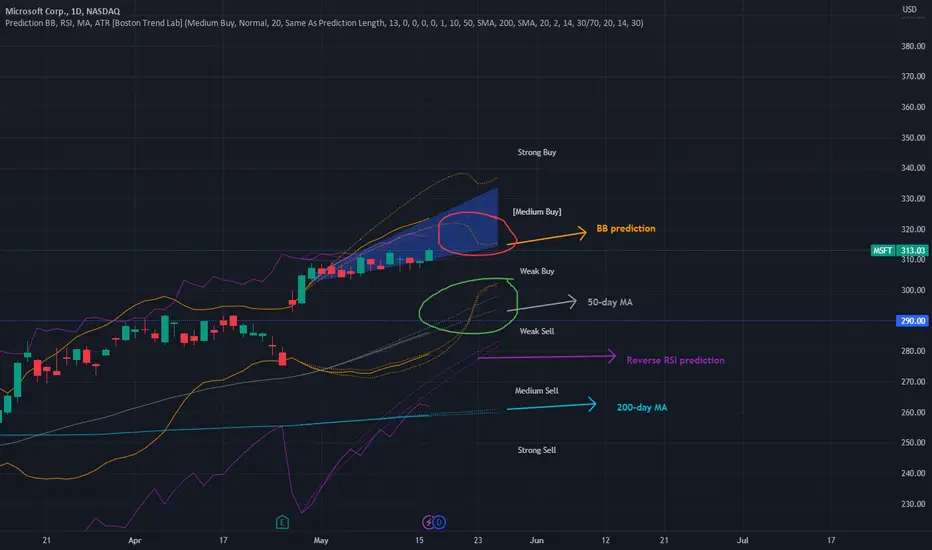
Small fall for growthThe stock's growth has been impressive in recent times; however, the prediction indicates that if the next breakout does not occur by May 19th, the upper band of the 20-day Bollinger Band will decrease, which may hinder sustained attainment of levels above 320. (Red circle)
To facilitate further growth, it would be beneficial to reinforce the resistance level at 290 - 295 at the intersection of the 50-day moving average. (Green circle)
Additionally, the RSI's 70 level limits further growth poten
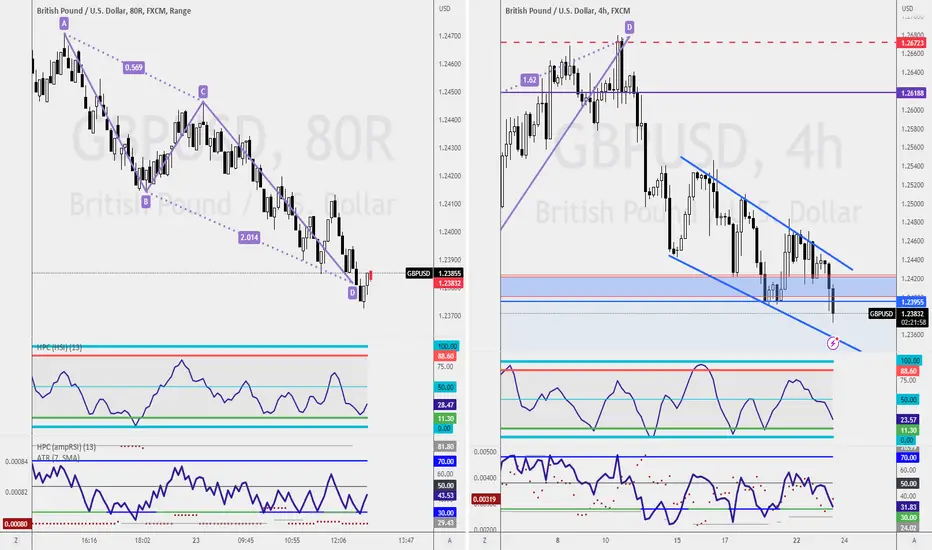
STOP! Read before you consider to engageHALT! Don't follow this trading idea blindly.
You should know that I've a strong bias to long the GBPUSD on the higher timeframe, the daily and weekly chart.
I'd engaged in a strategy that I've personally tested for the past 12 years.
The ABCD pattern showing up on the 8 range bar provide such an opportunity for me to engage the trade.
What is really needed is for the first target to be hit and that would give me the right to shift stops to entry and enjoy the ride.
The first 34pips(340usd
2nd Pine Script Lesson: Coding the Entry Logic - Bollinger BandWelcome back to our Trading View tutorial series! In this second lesson, be learning how to code the entry logic for a Bollinger Band indicator using Pine Script.
If you're new here and missed the first lesson, we highly recommend starting there as it provides a solid foundation for understanding the concepts we'll be covering today:
In this hands-on lesson, we'll guide you through every step of coding the entry logic for your own Bollinger Band indicator using Pine Script. By the end of thi
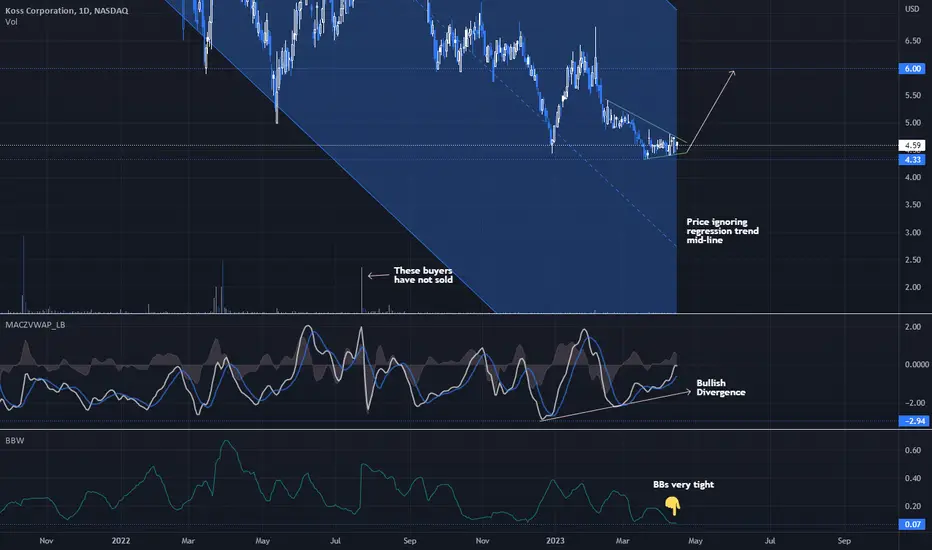
KOSS - ready to moveKOSS daily showing bullish diversion on a number of indicators and is resting on strong historic support levels at the current price. Further the price has been drifting away from the longer term regression trend midline, suggesting a change in direction is occurring.
Per the OBV buyers have generally held onto their shares since the run up that occurred last July. With the Bollinger's getting and staying tight, I expect KOSS will make a move to the upside fairly soon. Trade target is $6.
📊Bollinger Bands In A Trending MarketBollinger Bands are a widely used chart indicator for technical analysis created by John Bollinger in the 1980s. They offer insights into price and volatility and are used in many markets, including stocks, futures, and currencies. Bollinger Bands have multiple uses, such as determining overbought and oversold levels, as a trend following tool, and for monitoring for breakouts.
📍 Strategy
Bollinger Bands measure deviation and can be helpful in diagnosing trends. By generating two sets of ban
Bitcoin BTCUSD 6W To Tag Upper Bollinger Band Within 120 DaysBitcoin 6W Bollinger Bands - Each time, after the bottom was put in, within 7 bars BTC hit the upper Bollinger Band. In 2019, it did it in only 5 bars. In 2023, our 5th bar just opened. If BTC were to once again follow this trajectory of hitting the upper BB within 7 bars, this would suggest that we'll see BTC at $64K or higher within 3-4 months or ~120 days. I'm publishing this to see if the idea is valid.