ULTA: Doji Suggests the Pullback May Be Over — Next Leg Higher?Sometimes the important part of a breakout isn't the breakout itself...
It's what happens after the breakout.
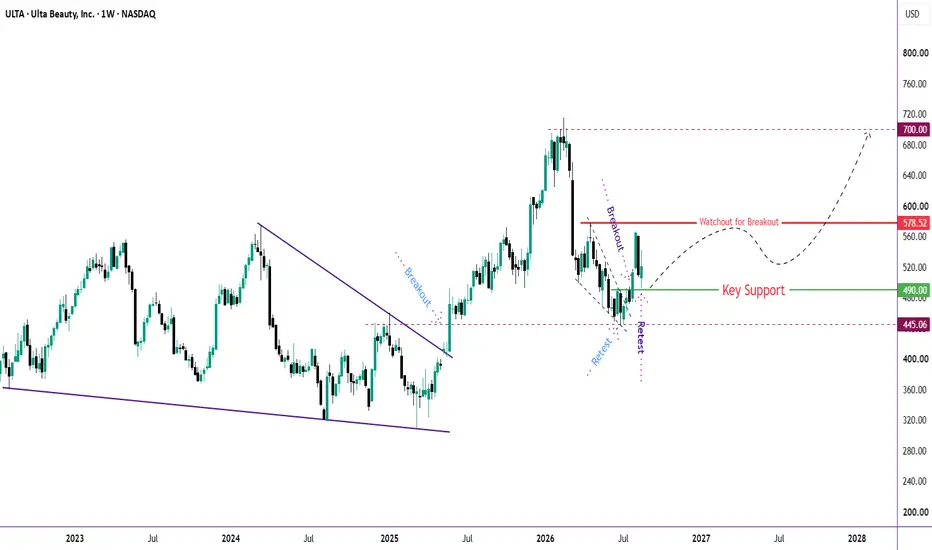
ULTA has been giving us an interesting sequence:
🔹 Broke out of the long-term falling structure
🔹 Ran all the way above $700
🔹 Pulled back sharply
🔹 Returned to $445 — the previous breakout level
🔹 Successfully retested that zone
🔹 Recovered and broke above $490
🔹 Reached $565
🔹 And now pulled back to retest the $490–500 area
And this is where the chart gets interesting. 👀
🧩 The lat
Doji
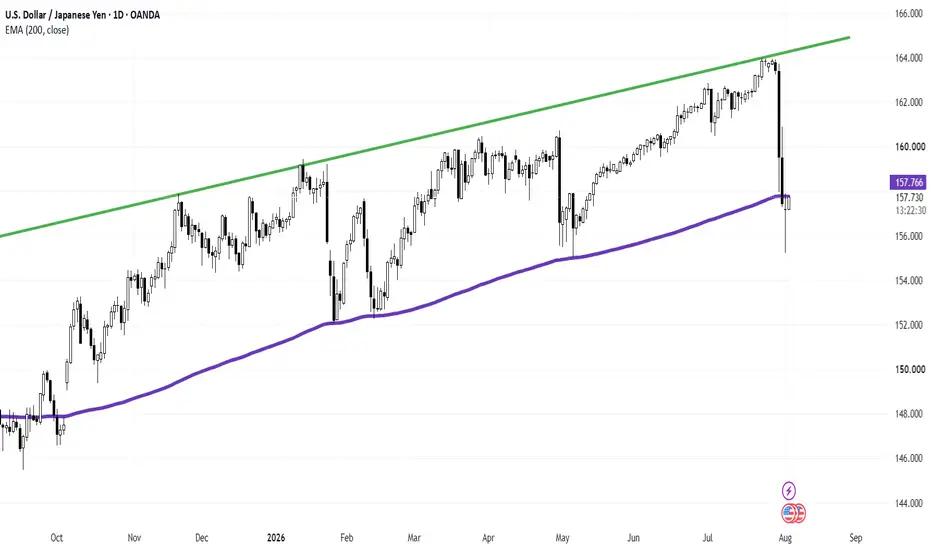
USD/JPY ($USDJPY) Daily: Long-Wick Indecision Candle USD/JPY ( FX:USDJPY ) Daily: Long-Wick Indecision Candle At 200-EMA Highlights Potential Rebound Off 157.76 Support
### 🇺🇸/🇯🇵 U.S. Dollar / Japanese Yen ( FX:USDJPY ) Daily Technical Framework (Ref: USDJPY_2026-08-04_08-32-51.png)
We are releasing a Daily (1D) technical update on FX:USDJPY following a violent multi-day sell-off originating from the channel resistance line (green top baseline near 164.000). The severe downside momentum has collided directly into the major institutional baselin
Doji Candlestick — When the Market Starts to HesitateThe Doji candle is one of the most fundamental patterns in Price Action. Its defining feature is that the opening and closing prices are almost identical, resulting in a very small or virtually nonexistent body.
The significance of a Doji isn't whether it's bullish or bearish — it lies in the hesitation it represents.
During that session, buyers tried to push price up, and sellers tried to pull it down, but ultimately neither side truly gained control of the market. Price closing near its open
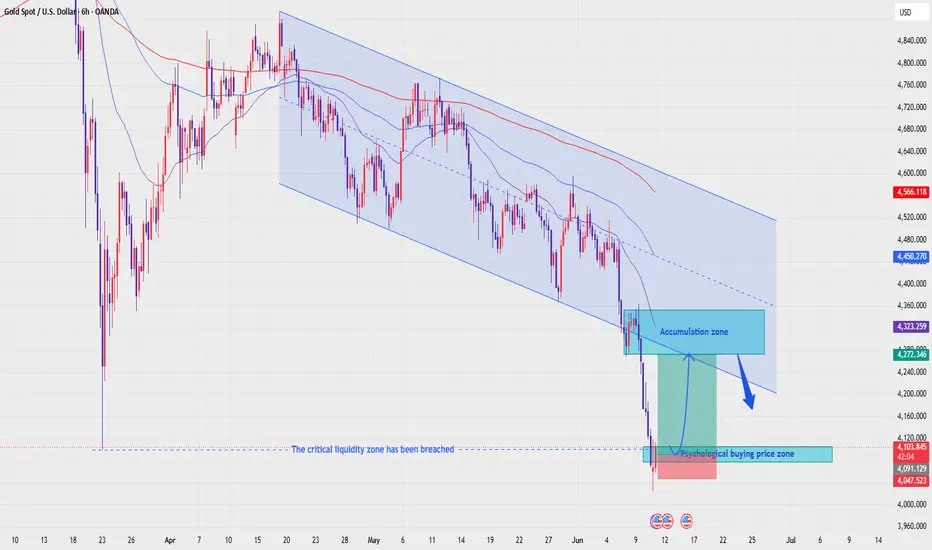
XAUUSD — Doji Reversal From Psychological Buy Zone
Fundamental Analysis
Gold remains sensitive after a strong bearish move into lower liquidity. The market is still watching USD strength, Treasury yields, and upcoming U.S. data, which may create volatility around the current support zone.
For now, the broader pressure is still bearish, but the reaction from the psychological buying zone shows that a short-term recovery may develop if buyers confirm control.
Technical Analysis
On the 6H chart, XAUUSD is still moving inside a descending chan
Strong bullish signals on high timeframes = a market convinced INTRODUCTION:
This is a microcap bio so risk should be managed by strictly limiting position size. I won't bother talking about any fundamentals. We all know what makes startup bios move.
THE TA:
The above 1M chart provides a clean structure and a view of the following base bullish observations:
1. Overall downtrend is still intact but showing signs of imminent breaking.
2. The structural low at circa $0.54 was followed by a break of local downward diagonal resistance and the opening of
Part 1: Doji Trap - Why Traders Misread Market IndecisionHello Traders, this article has two parts: theory for understanding the concept, and practical for real market application.
What is a Doji?
---------------------
A Doji candlestick forms when the open and close prices are nearly equal. It shows that buyers and sellers fought, but neither side gained clear control. Think of it like a tug of war ending in a draw.
Psychology Behind It
----------------------------
A doji tells you:
1. Buyers pushed the price
2. Sellers pushed back
3. Marke
Most Traders Ignore This… But It Moves Price█ Most Traders Ignore This… But It Moves Price
Everyone watches the price.
Almost no one watches where real trading actually happens.
And that’s the difference.
█ The Signal Most People Misread
When you see a doji, most think:
“Indecision… nothing happened.”
That’s wrong.
If that doji forms with rising, high volume, something very important just happened:
Price tried to move.
A lot of traders got involved.
But neither side won.
That’s a battle with size behind it.
█ What I
Indecision on the Chart: What These Candles Really MeanIndecision in the market? You're not alone. Every trader has faced those moments when the charts seem to scream confusion. But here's the thing: indecision candlestick patterns aren't just noise. They hold secrets that, when decoded, can give you the upper hand. Let's dive in and learn how to spot these patterns and use them to your advantage.
Mastering Indecision Candlestick Patterns
The most well-known indecision candles are the Doji, Spinning Top, and High Wave Candle. These candlestick
Doji Candlestick: A Key to Market ReversalsAlright, let’s break down the Doji candlestick pattern.
If you're trading crypto, you've probably bumped into this little guy at some point. It’s not a wild trendsetter on its own, but it definitely has something to say about the market’s mood 🤔. The Doji is one of those candlestick patterns you’ll want to pay attention to if you're trying to catch reversals or just understand what's going on in the market.
What is the Doji Candlestick Pattern?
A Doji candlestick pattern forms when the o
SENSEX: Intraday Levels for 10th SEP 2025 (BSE30)SENSEX Spot: Intraday Levels for 10th SEP 2025
^^^^^^^ Plot Levels Using 3 Min, 5 Min Time frame in your Chart for Better Analysis ^^^^^^^
L#1: If the candle crossed & stays above the “Buy Gen”, it is treated / considered as Bullish bias.
L#2: If the candle stays above “Sell Gen” but below “Buy Gen”, it is treated / considered as Sidewise. Aggressive Traders can take Long position near “Sell Gen” either retesting or crossed from Below & vice-versa i.e. can take Short position near “Buy G
Ethereum climbing, but RSI throwing shade stay sharpGuys, I’ve also put together an Ethereum analysis for you.
Ethereum is an amazing coin that’s not up for debate. But it’s already climbed quite a bit. I haven’t bought in at this point, but if it drops to the 3,538.0 – 3,357.0 range, I’d definitely be looking to buy.🔥
Right now, we’re in an uptrend, but on the 1‑day chart I spotted a divergence on the RSI indicator. It looks like this divergence might be playing out. If the price falls below the 4,000 level, that would confirm the divergence i
Indecision - The Human Experience of Being A DojiContext : Daily Chart ETHUSD.
Uptrend intact.
Price sitting right on the trend line.
Price consolidating into a series of dojis.
Imagine this scenario.
You have a plan.
You're a trend trader.
You're looking to get long.
You start to observe the context…
We’re into September.
Tech showing signs of correcting.
Gold heading up.
This chart... right here, right now is consolidating.
And so you experience a little flicker.
A small niggle …
There it is.
The voice of doubt.
"I should get long bu
AMD — Watch for Pivot Reversal or Trend ContinuationMarket view
Actual volatility is high, confirmed by the Volatility Bars indicator.
The rate of change in the SMA is decreasing, suggesting momentum is weakening.
The previous candle was a Doji, indicating short-term indecision.
Price closed below the prior day’s low, adding bearish pressure.
A potential Pivot Point reversal is forming.
This reversal setup is confirmed by increasing Convolution Probability, supporting a higher chance of a directional move.
Tr
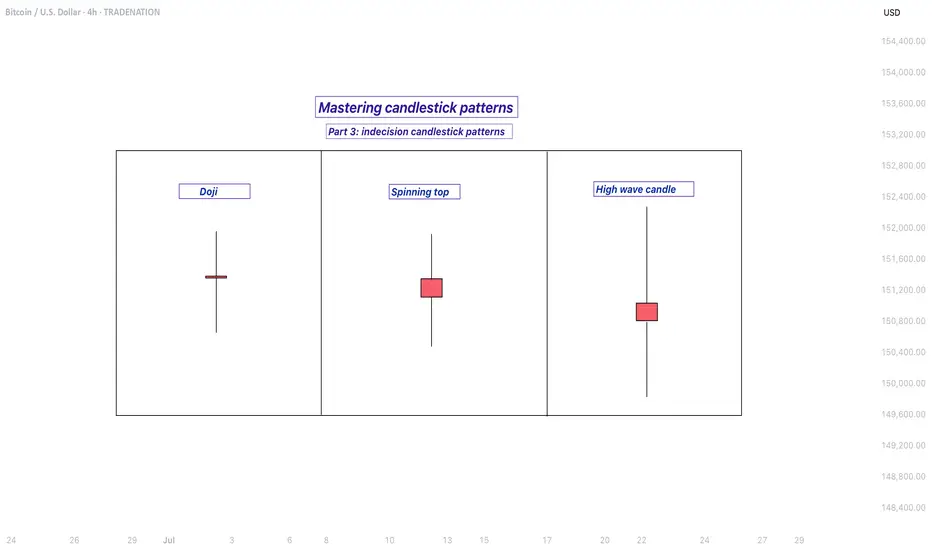
Mastering indecision candlestick patterns - How to use it!In this guide I will explain the indecision candlestick patterns. The next subjects will be discussed:
- What are indecision candlestick patterns?
- What is the doji?
- What is the spinning top?
- What is the high wave candle?
What are indecision candlestick patterns?
Indecision candlestick patterns are formations on a price chart that suggest uncertainty in the market. They appear when neither buyers nor sellers have full control, meaning the price moves up and down during the trading period
Mastering bullish candlestick patterns - How to use it!In this guide, we will explore some of the most important bullish candlestick patterns used in technical analysis. These patterns are essential tools for traders and investors who want to better understand market sentiment and identify potential reversal points where prices may start moving upward.
What will be explained:
- What are bullish candlestick patterns?
- What is the hammer?
- What is the inverted hammer?
- What is the dragonfly doji?
- What is the bullish engulfing?
- What is the mo
#TAOUSDT #4h (ByBit) Ascending trendline near breakdownBittensor printed an evening doji star deviation, a retracement down to 200 MA support seems next.
⚡️⚡️ #TAO/USDT ⚡️⚡️
Exchanges: ByBit USDT
Signal Type: Regular (Short)
Leverage: Isolated (5.0X)
Amount: 5.0%
Entry Targets:
1) 430.38
Take-Profit Targets:
1) 362.01
Stop Targets:
1) 464.64
Published By: @Zblaba
GETTEX:TAO BYBIT:TAOUSDT.P #4h #Bittensor #AI #DePIN bittensor.com
Risk/Reward= 1:2.0
Expected Profit= +79.4%
Possible Loss= -39.8%
Estimated Gaintime= 1 week
How to Trade Doji Candles on TradingViewLearn to identify and trade doji candlestick patterns using TradingView's charting tools in this comprehensive tutorial from Optimus Futures. Doji candles are among the most significant candlestick formations because they signal market indecision and can help you spot potential trend reversal opportunities.
What You'll Learn:
• Understanding doji candlestick patterns and their significance in market analysis
• How to identify valid doji formations
• The psychology behind doji candles: when buy
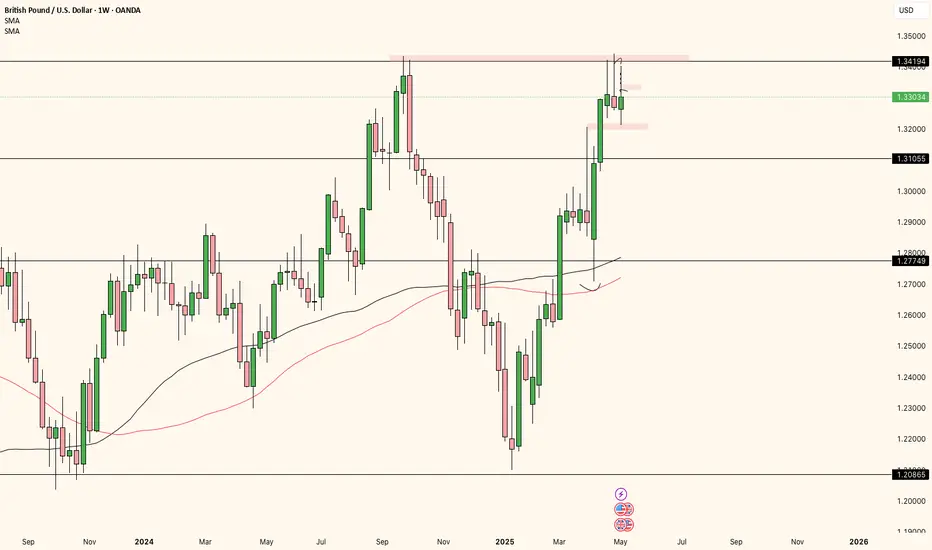
GBPUSD ANALYSISThe weekly candle rejected weekly resistance and closed as a doji for consecutive weeks, which could mean price could be transitioning to a bearish market. Overall price is still bullish, but it did form an H4 LH so I'd look for price to retrace to the H4 support. If price breaks & retest minor M15 support around 1.32970, I'd start looking for sells with my TP being 1.32100.
Daily and weekly poised for a bull run, BULL FLAG $SKLZPersonally see 6.89-7.33 in the coming weeks potentially 9$-10$ by summer with momentum and positive ER. SKLZ is a sleeping giant
Many analyst say its a buy and the chart is bullish for a 6month swing trade easy or a great long term position. Final time we see south of 5$ !?
We shall see, in time
SLong
$GLD - bullish momentum soon to stallHello, I was bullish on AMEX:GLD for a bit and now examining the charts, multiple frames, this may be setting up for a good short. If geopolitics and tariff talks deescalate then this should cool off. The Elliot wave placed indicates some time for a correction/pull back on this hot commodity and the candle on the Daily from Friday is a spinning stop doji which can indicate reversal in an uptrend. Also, we have so many gaps up that happened in 3 day span, crazy actually. I labeled areas of targ
Mastering Candlestick Patterns for better trades!Candlestick patterns are a powerful tool for identifying market sentiment and potential reversals. Let's break down some key single and double candlestick formations seen in this chart:
🕯️Single Candlestick Patterns:
- Doji – Represents indecision in the market, signaling a potential reversal.
- Inverted Hammer – A bullish reversal pattern after a downtrend, indicating buyers are stepping in.
- Long-Legged Doji – Suggests market uncertainty; watch for confirmation before taking a position.
- Be