Bullish bounce off 38.2% Fibonacci support.LTC/USD is falling towards a support level which is a pullback support that lines up with the 38.2% Fibonacci retracement and could potentially bounce from this level to our take profit.
Entry: 83.53
Why we like it:
There is a pullback support level which lines up with the 38.2% Fibonacci retracement.
Stop loss: 81.25
Why we like it:
There is a pullback support level.
Take profit: 87.53
Why we like it:
There is a pullback resistance level which lines up with the 78.6% Fibonacci retracement.
Ichimoku Cloud
Copper Breaches Key Support but Tech & Fundamentals FavorableThe commodity has registered a notable pullback from last month’s record highs and has now moved below the pivotal EMA200 (black line) and 38.2% Fibonacci of this year’s advance. This pauses the bullish momentum and exposes Copper to the ascending trend line from the 2024 low and the daily Ichimoku Cloud.
However, this region could contain the correction and multiple roadblocks follow, making the downside unfriendly, while the RSI points to oversold conditions. As such, we expect Copper to fin
LTCUSDT Some Tips To Know For Accurate RBIHi, friends. Nice to meet you. Long time no see
I'm sorry I couldn't share my perspective because I had some personal busy work for a while
Today, we did a chart analysis on LTC
■I checked the selling RBI point.
■ Please refer to the RBI near the support resistance line
■ After identifying the big trend, write the opposite trend line and enter the big trend line
■The current (green circle) has a support line, so it is recommended to enter when retesting after breaking through rather than
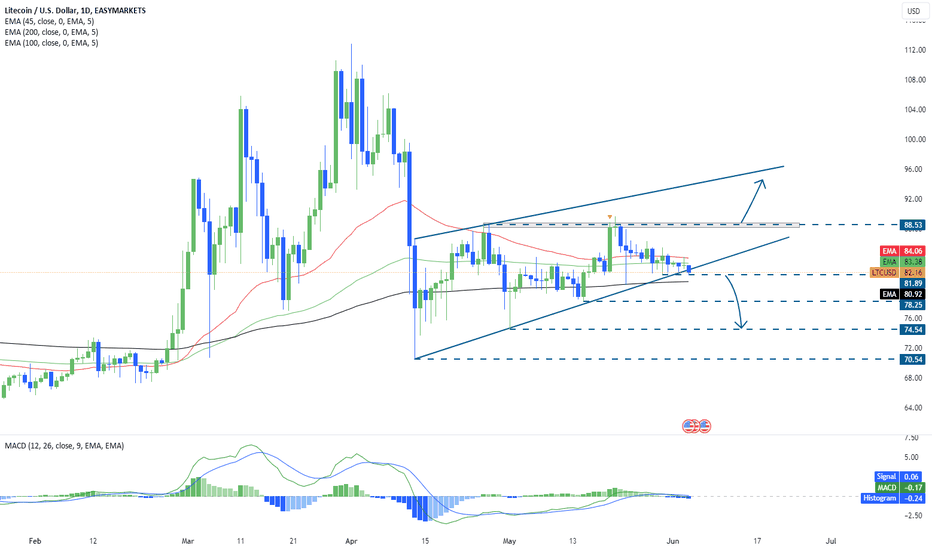
Is Litecoin showing signs of weakness? #LTCUSD EASYMARKETS:LTCUSD
Disclaimer:
easyMarkets Account on TradingView allows you to combine easyMarkets industry leading conditions, regulated trading and tight fixed spreads with TradingView's powerful social network for traders, advanced charting and analytics. Access no slippage on limit orders, tight fixed spreads, negative balance protection, no hidden fees or commission, and seamless integration.
Any opinions, news, research, analyses, prices, other information, or links to third-p
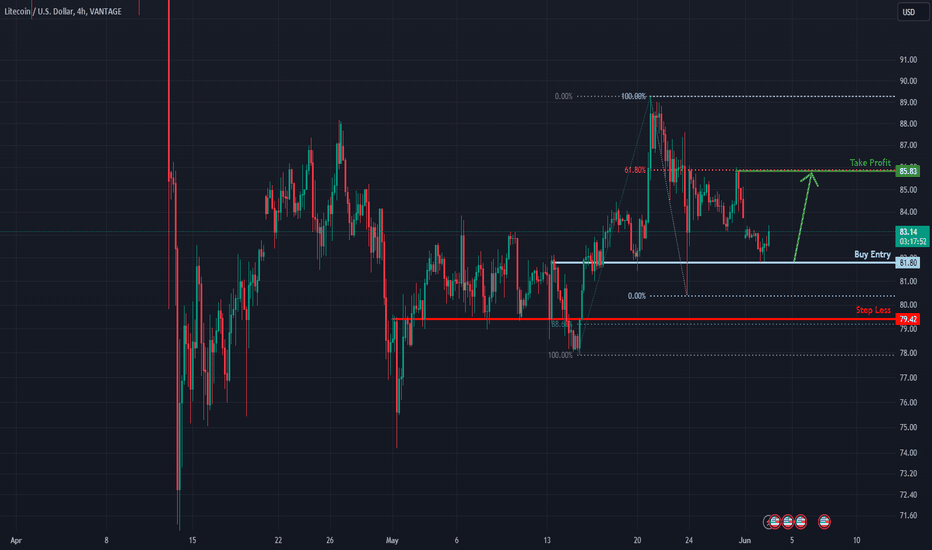
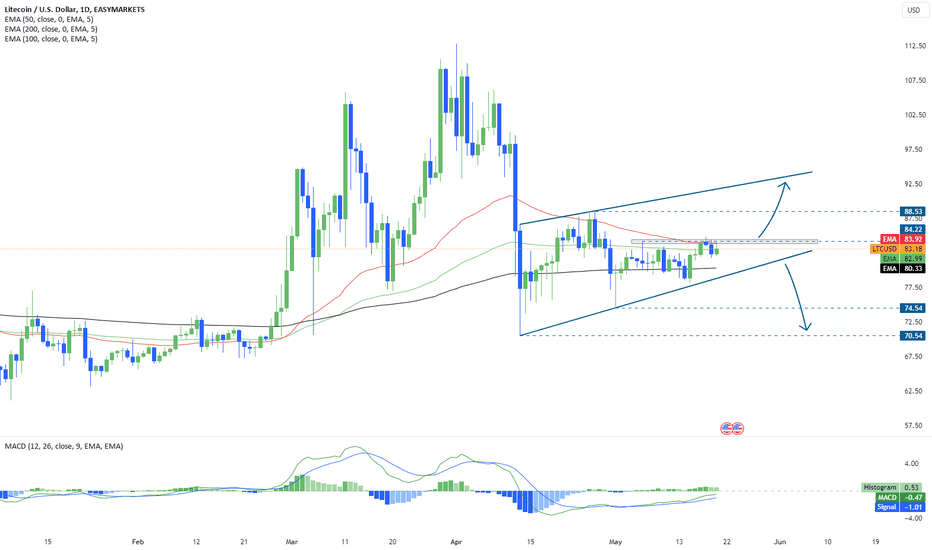
Potential bullish rise?LTC/USD has bounced off the support level which is an overlap support and could rise to our take profit.
Entry: 81.80
Why we like it:
There is an overlap support level.
Stop loss: 79.42
Why we like it:
There is a pullback support level which lines up with the 88.6% Fibonacci retracement.
Take profit: 85.83
Why we like it:
There is a pullback resistance level which lines up with the 61.8% Fibonacci retracement.
Please be advised that the information presented on TradingView is provided to Van
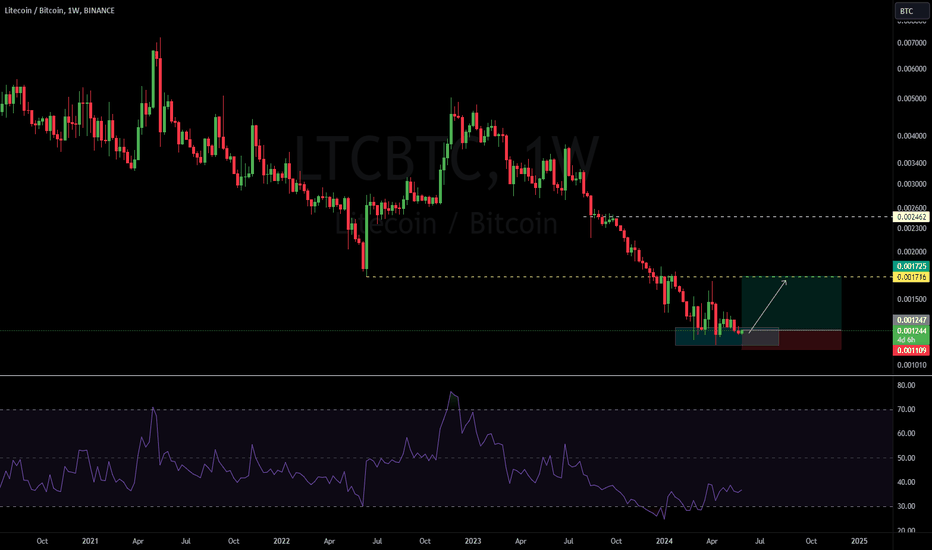
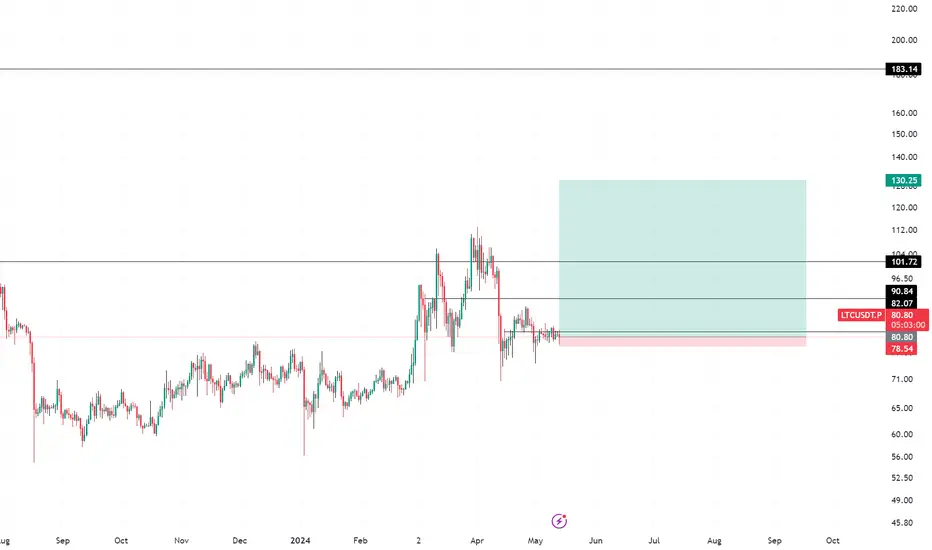
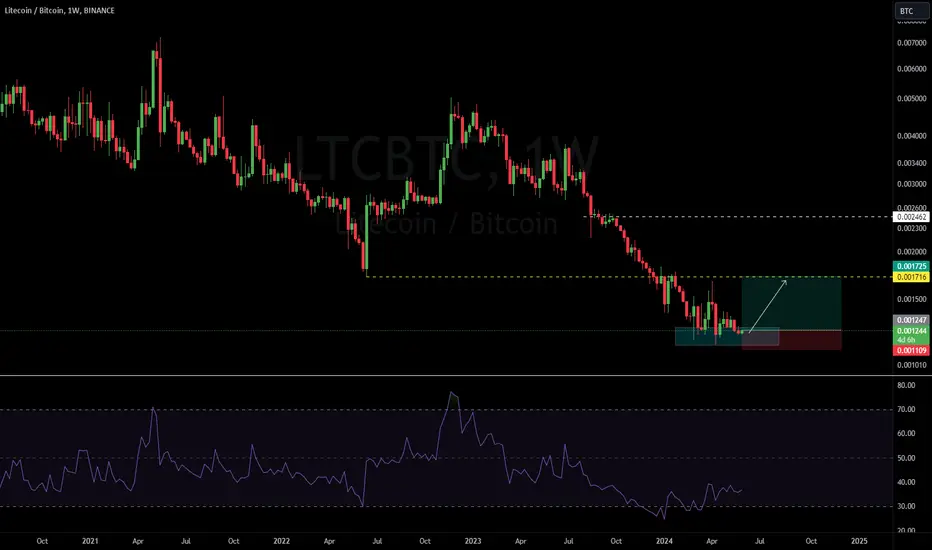
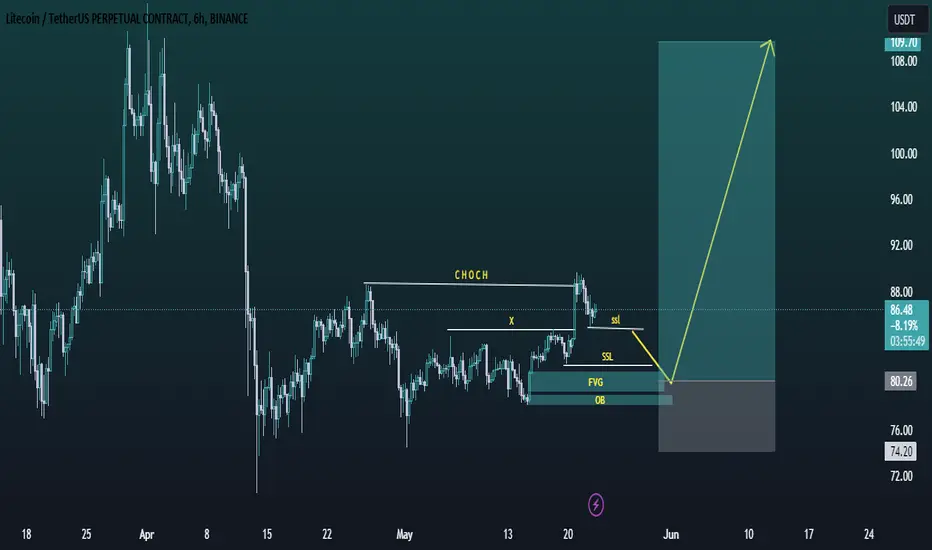
Best Risk/Reward ratio of MayThis is my third and final attempt at a Litecoin pump, this coin seems to be ready for a huge green redacted candle.
I'm buying with low size and will increase as it begins moving favorably. This trade should last around 3 months.
P.S yes, i'm serious with that tight stop-loss.
LFG
LTC: big reward📊 Analysis by AhmadArz:
1. Support and Resistance Levels:**
- Support:** Around $82.80.
- Resistance:** Approximately $88.00 and $96.82.
- 📉🛑
2. Trend Channels:**
- Currently, the price is moving within a horizontal range and appears to be awaiting a breakout.
- 📈📊
3. Trading Strategy:**
- Buy Zone:** Enter buy positions if the price breaks and surpasses the $84.15 level.
- Target Price (TP):**
- TP-1:** $96.82
- 💹💰
-Stop loss: 82.80
⛔
4. Overall Trend:**
- T
LTCUSD - Large Rise During Gaussian Channel Down Period As seen in ~2017 the bear phase is very short and leads to a massive rise
I suspect this will occur for Litecoin again after years of weak performance
Great long buy
In the 2017 scenario price was similarly trending under the middle line of the channel.
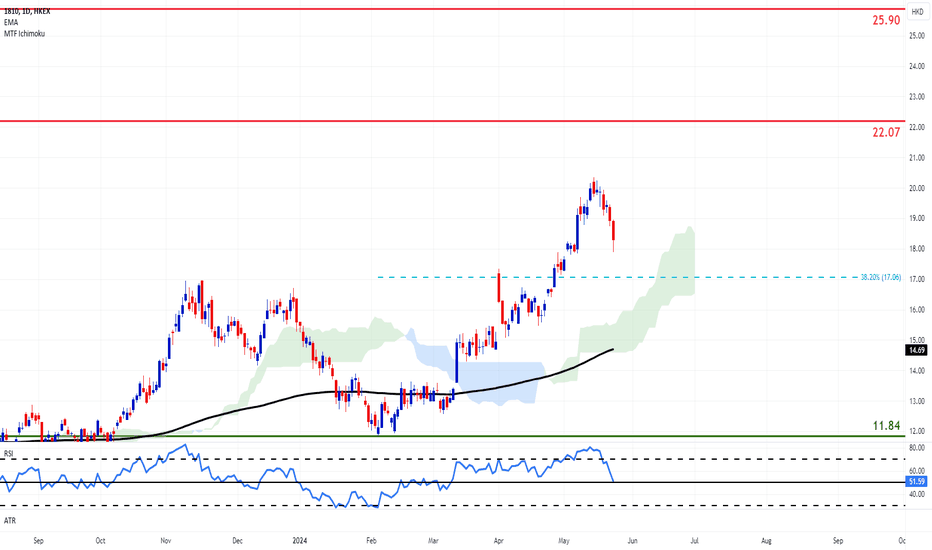
Xiaomi Drops but Strong Results & EV Entry Are SupportiveThe stock of Xiaomi posts its first losing week in more than a month, despite its mostly strong quarterly results on Thursday and the upgraded guidance on EV deliveries. The drop likely reflects the broader decline of the Hang Seng Index due to geopolitical concerns. It also makes sense from a technical standpoint, since it had reached highly overbought levels.
It is now at a critical technical juncture, as it tests the 50 line on the RSI and is exposed to the 38.2% Fibonacci of this year’s adv
Kiwi Upside Bias Strengthened after Hawkish RBNZThe Reserve Bank of New Zealand delivered a hawkish hold on Wednesday, as it raised the OCR forecast to 5.7%, leaving room for further tightening. Policymakers believe that longer restriction may be needed to achieve the 1-3% inflation target and also upgraded their forecast, expecting CPI to fall less and slower than previously thought.
The US Fed meanwhile has adopted a cautious stance towards removing monetary restraint, due to stubborn inflation this year, strong economy and robust labor ma
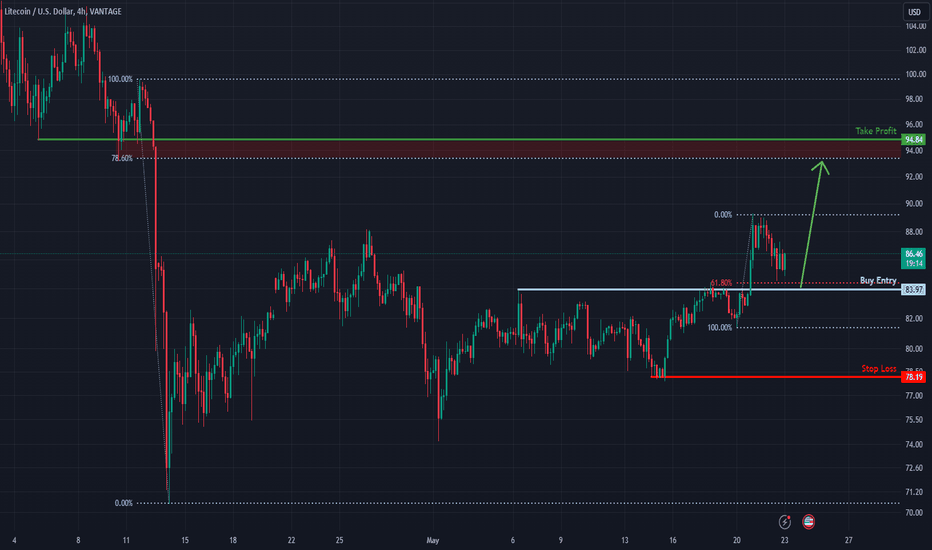
Could LTC/USD bounce from here?LTC/USD is falling towards a support level which is a pullback support that aligns with the 61.8% Fibonacci retracement and could bounce from this level to our take profit.
Entry: 83.97
Why we like it:
There is a pullback support level that lines up with the 61.8% Fibonacci retracement.
Stop loss: 78.19
Why we like it:
There is a pullback support level.
Take profit: 94.84
Why we like it:
There is a pullback resistance level which is slightly above the 78.6% Fibonacci retracement.
Please be a
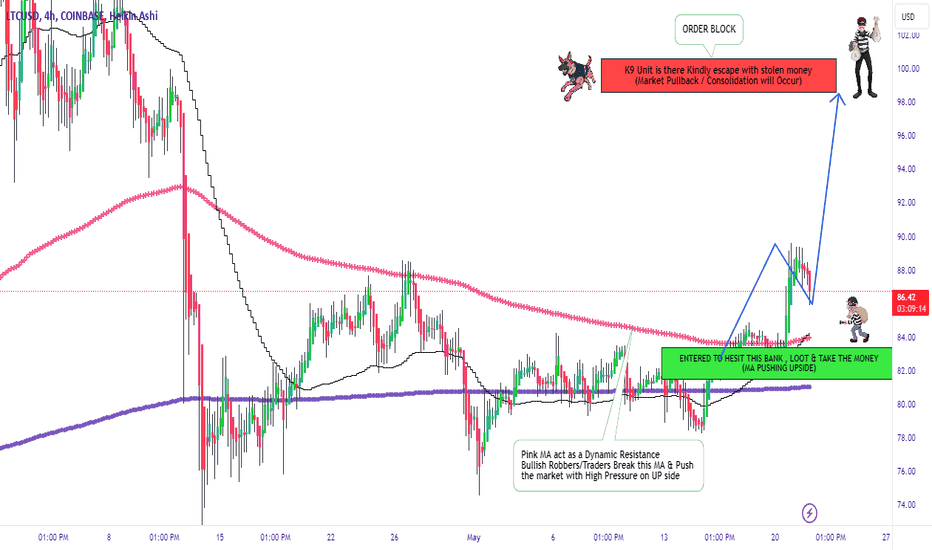
LTCUSD Bullish Robbery Plan To Make MoneyMy Dear Robbers / Traders,
This is our master plan to Heist LTCUSD Bank based on Thief Trading style Technical Analysis.. kindly please follow the plan I have mentioned in the chart. Our target is Red Zone that is High risk Dangerous Level, market is overbought / Consolidation / Trend Reversal at the level Bearish Robbers / Traders gain the strength. Be safe and be careful and Be rich.
Note: If you've got a lot of money you can get out right away otherwise you can join with a swing trade robbers
Litecoin (LTCUSD) Quick Video IdeaEASYMARKETS:LTCUSD
Disclaimer:
easyMarkets Account on TradingView allows you to combine easyMarkets industry leading conditions, regulated trading and tight fixed spreads with TradingView's powerful social network for traders, advanced charting and analytics. Access no slippage on limit orders, tight fixed spreads, negative balance protection, no hidden fees or commission, and seamless integration.
Any opinions, news, research, analyses, prices, other information, or links to third-party site
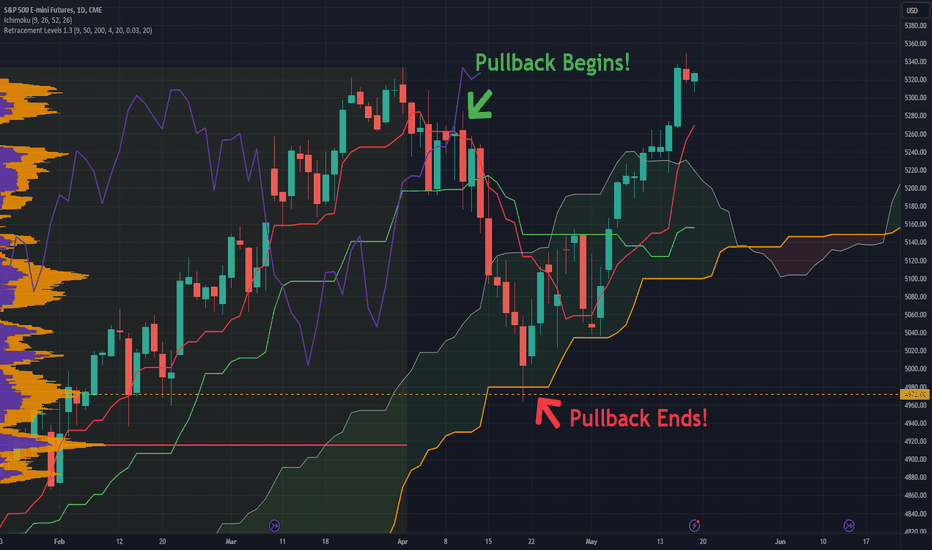
Can we time the market? YES!There is an old, seemingly wise saying, that says "time in the market beats timing the market!" This works for people that do not want to do the work... to study repeatable patterns.
Throughout the bull market of 2024 (yes, the market is in a bull market) I have been waiting for and been asked by followers "is THIS the pullback to go long?" Generally, the answer is no and I have a reason rooted in Technical Analysis that I talk about in this video.
But eventually... the market reveals itself
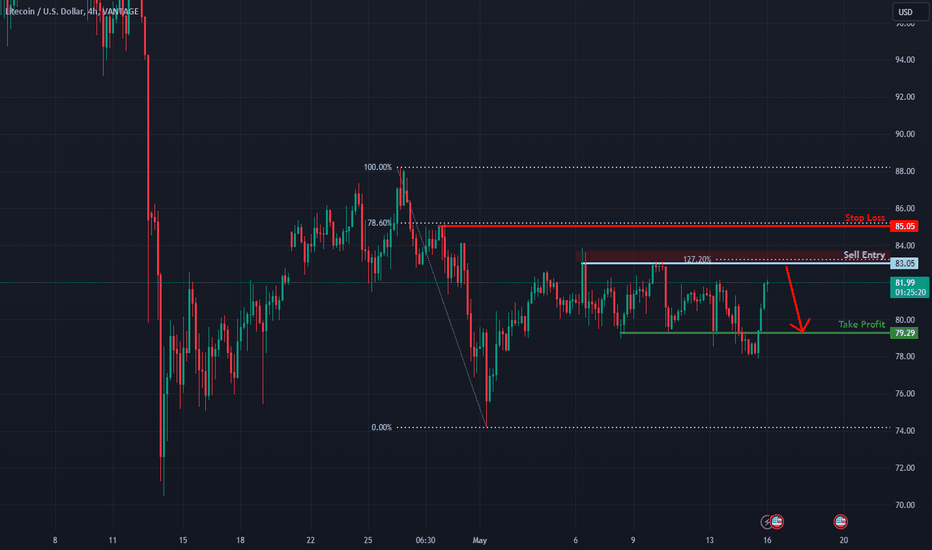
LTC/USD is rising towards 127.2% Fibonacci extension?Price is rising towards a resistance level which is a pullback resistance level that lines up with the 127.2% Fibonacci extension and could reverse from this level to our take profit.
Entry: 83.05
Why do we like it:
There is a pullback resistance level that lines up with the 127.2% Fibonacci extension.
Stop loss: 85.05
Why we like it:
There is a pullback resistance level which aligns with the 78.6% Fibonacci retracement.
Take profit: 79.29
Why we like it:
There is a pullback support level.
P
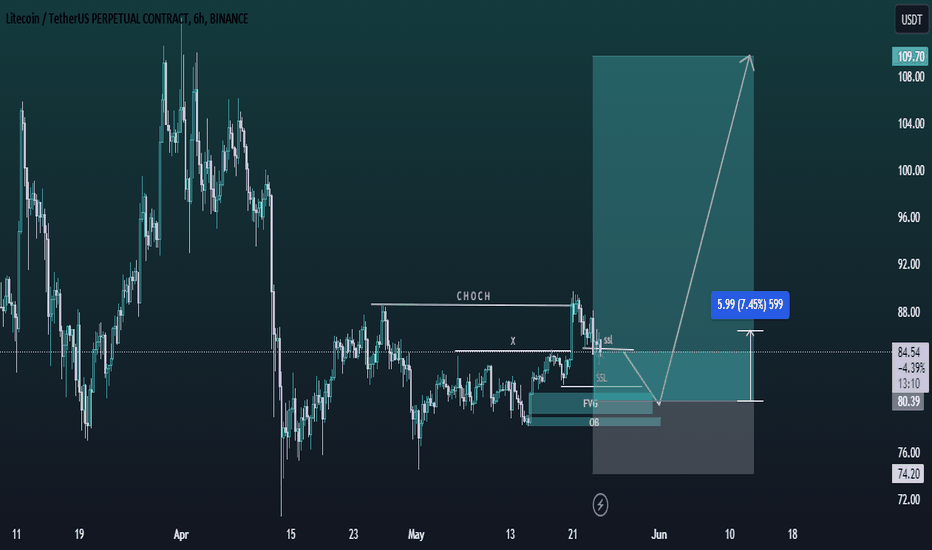
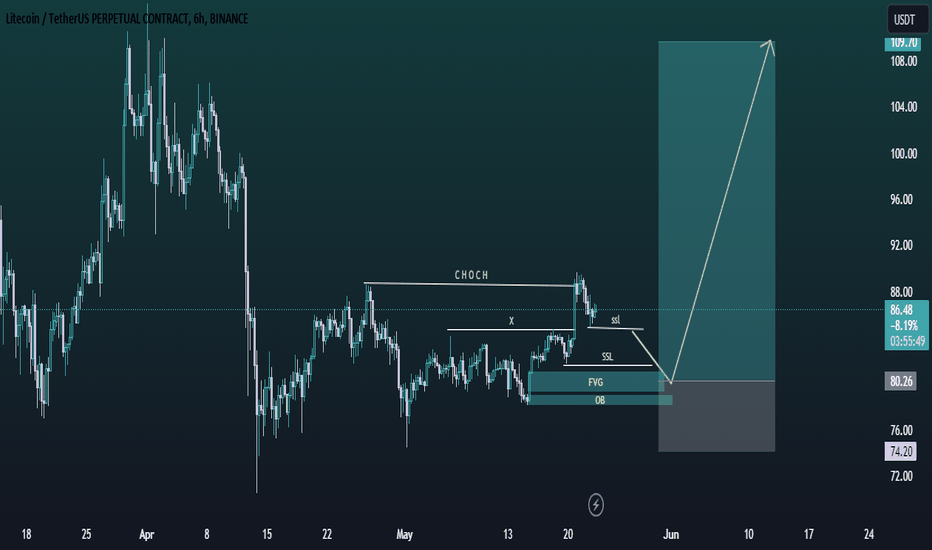
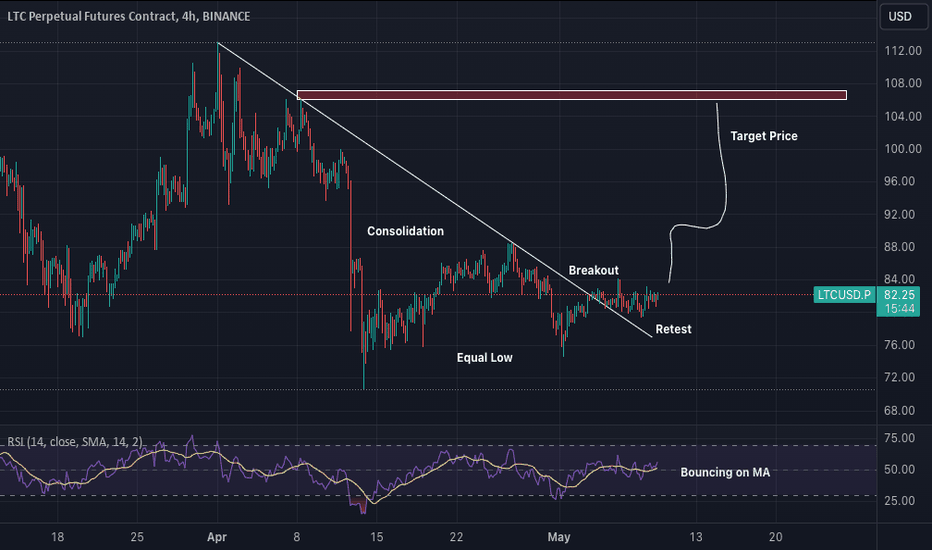
$LTC to Touch $110 After BreakoutCRYPTOCAP:LTC has honestly been having some sort of shitty price action in the previous weeks before now, it is also apparent that there's some bullish catalyst that is currently surrounding it, especially concerning positive news.
Speaking solely from the angle of price action and trend analysis, CRYPTOCAP:LTC has broken out from its long-term consolidation on the 4hr chart and is billed to move higher as the market continues to either consolidate or trend positively.
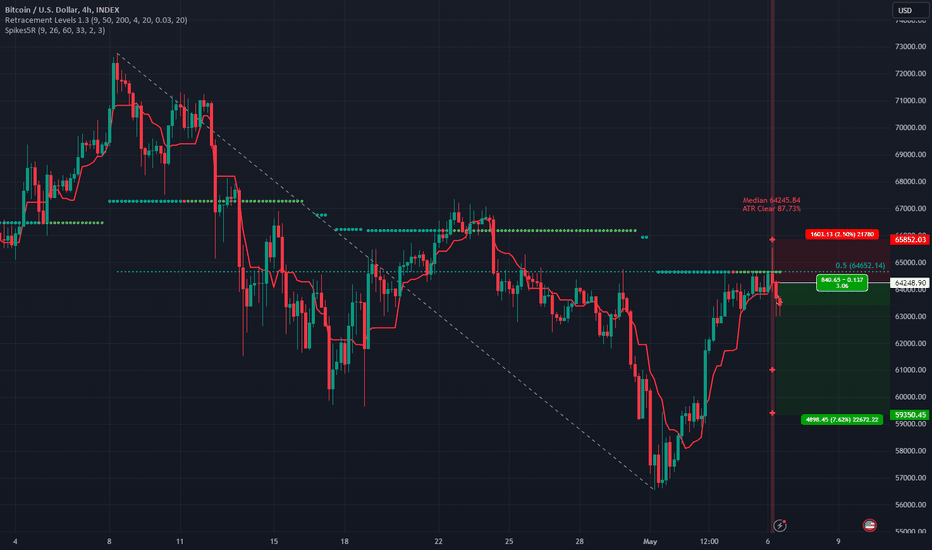
Bitcoin Spike at ResistanceBitcoin HELD the Last Support noted in my Idea last week. That save INDEX:BTCUSD from going bearish. However, it is not out of the woods yet.
Today Bitcoin spiked the 50% Retracement Resistance at 64652. This sets up a short trade where if the high of the spike is broken "you know you're wrong" for a low risk/high reward trade. If the Spike high is broken... Bitcoin may trend bullish and even resume the full bull trend onward to 100k+. However, if this spike is a reversal and price retes
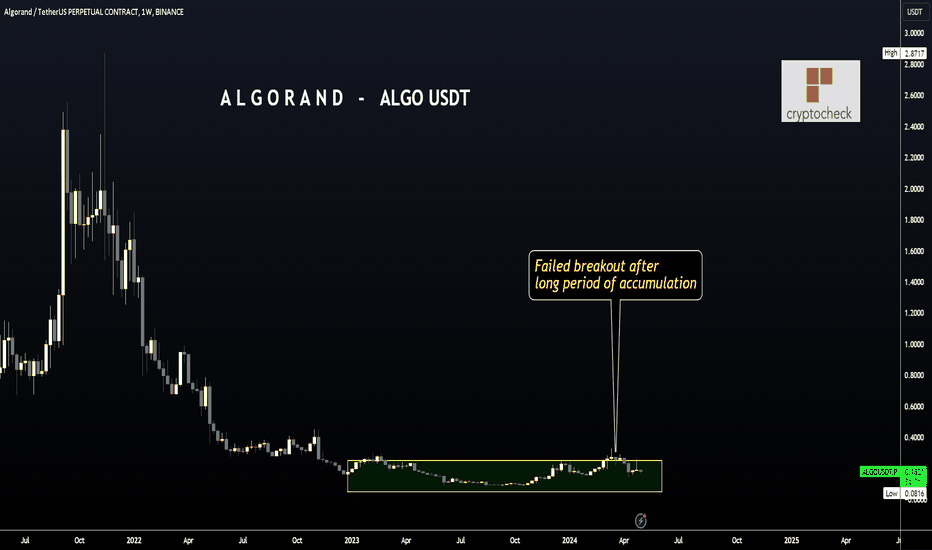
Take CAUTION with these ALTS : ALGO, LTC, XRP, HBARIt's time to review which altcoins showed sign s of strength during the recent new Bitcoin All Time High (ATH) ... and which showed no strength.
Together with the failed breakout we observe on Algorand, THESE altcoins didn't fare much better. There are a few more, but let's focus on these alts for today:
What we're comparing this chart to, is the obvious increase we have seen on BTC (new ATH) and the following increases across other altcoin markets:
During the previous cycles; we often saw
Bitcoin Price at CRITICAL Point!As a follow-up to my Idea from May 1st where I pointed out the key Volume Profile Support of 56.9k that has held and now we go into the weekend at the Volume Profile Resistance of 62k.
Which of these breaks... Support or Resistance... will be the way Bitcoin goes! Does the bull trend fail or continue? Ichimoku will be the decider.
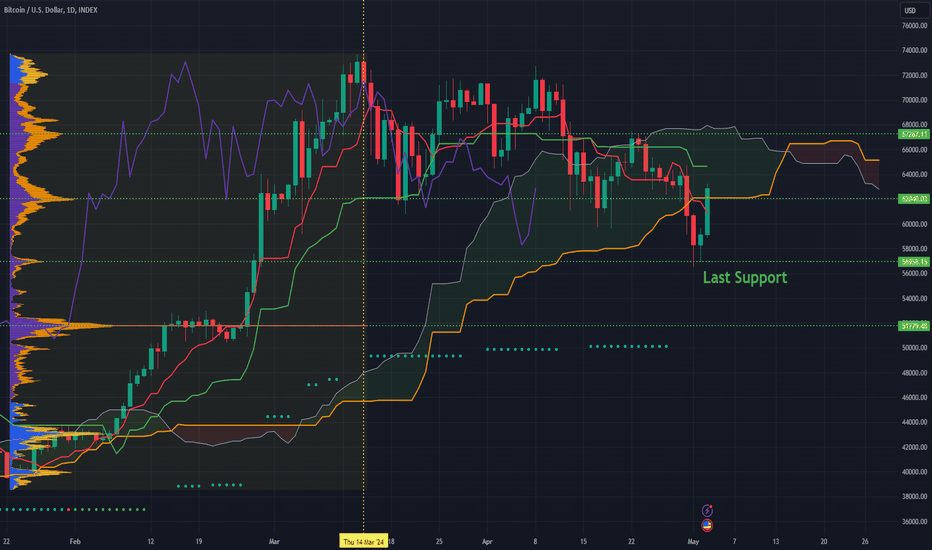
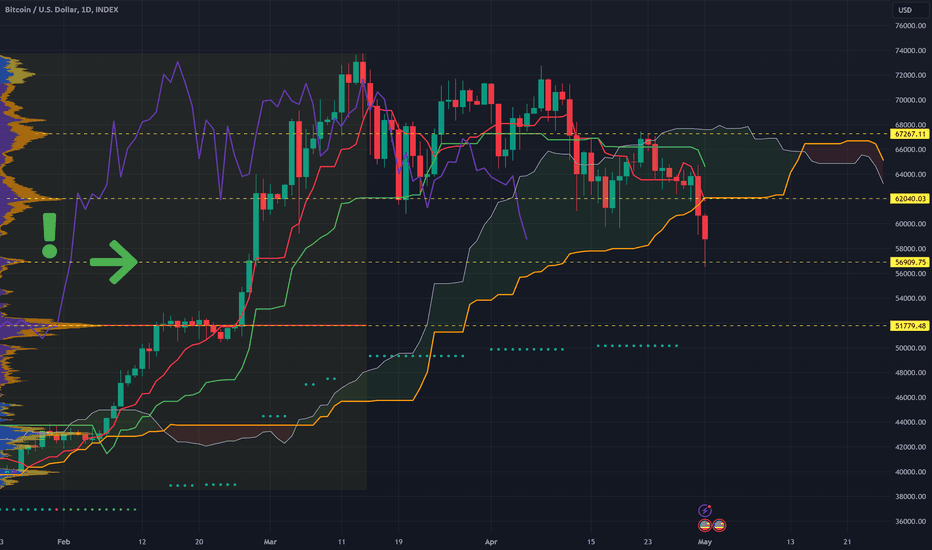
Last Support for BitcoinToday Bitcoin has hit the last level of Support for the Bullish Trend that has persisted since October 2023. This comes after making a new All Time High but failing to truly capture the prior All Time High by closing decidedly above it on the Weekly/Monthly.
The Level in question price has hit is a medium-significance Volume Profile level from the bullish trend. Volume Profile has had incredible efficacy in predicting the inflection points of Bitcoin during the last few months.
The signific