Long
Long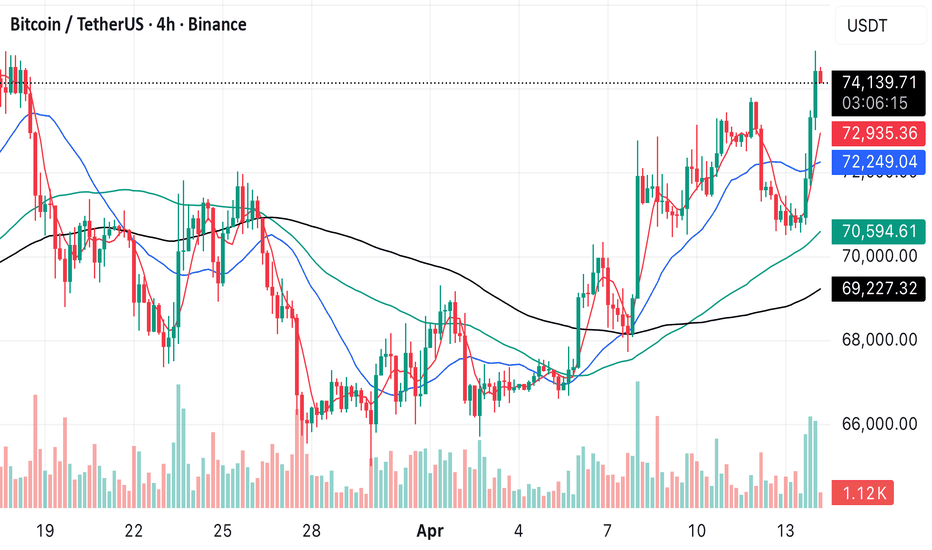
Making my profits bloom - long BE at 168.57So let me start by saying that what you see on the chart isn't anything special - any idiot trading Bloom in the past year could have made bathtubs full of money using just about any long method out there, including simply tossing a coin on any given day and buying. I make no special claims in that regard.
I am here today because Bloom is in my #1 conviction space for this year - energy. Most specifically, energy related to AI data centers. I think that we will soon be running into the same thing that we've already run into with the likes of MU and SNDK - too much demand, not enough supply. I think that it's just getting started, too.
Everyone is fretting about AI spend, but think about it - the likes of GOOG, AMZN, META etc. are still spending like crazy. The components makers have rightly shot up with them. But much of that capacity hasn't even been built and come online yet. The energy demand curve will always trail the build out curve. This confers 2 advantages:
1- the demand for energy hasn't yet hit the mind-blowing levels demand for hardware has.
2 - if/when AI buildout peaks, energy demand will not yet have peaked, so if there is indeed an AI bubble (and I personally do not think that comes ANY time soon with regard to fundamentals), companies like Bloom will get advanced warning from dropoffs in the chip and memory makers' backlogs/orders. I think it is a much safer way to play AI if you are scared of a bubble.
But if you follow me, or even look at this chart, you know that I don't ever stick around to wait until parties are over if I can help it. My trades are designed to be quick hitters, to take the money and run. And here is the most important reason I am here. It's not because I'm an amazing stock picker who buys and holds for 20x gains. That life is too dangerous for me. When the party does stop, or is even perceived to be over, I'd get crushed unless I can do what 98% of humanity can't, which is pick exact tops - and I can't. But occasionally, as the chart shows as well, I catch them anyway. I am here because if this is a top for Bloom, it doesn't really matter.
The same method I am using here, which has admittedly underperformed simply buying and holding of Bloom this year, was first tested in situations like Feb of 2021 to the fall of 2024 when buy and holders of Bloom would have lost 80% diamond-handing it all the way down. And I'm not criticizing them. If they are still holding, they're way ahead. But they had to survive that 80% drawdown and I bet most who were long at the beginning of that didn't stay in until now. I don't like doing that. I have to know that ups or downs, I will make money. Always more on the ups than the downs, but I don't want to have to weather massive drawdowns.
This method was 118-8 during that 80% meltdown in Bloom. And to be sure, there were some lots that got bombed. In fact, the first lot I'd have bought during that drawdown would have been the day after the absolute top. That lot was with me the whole way down. The difference is, all along the way, I would have made bank to offset that loser (and the 7 others who joined it that were down 8-65% as well). At the bottom, including the losers, I'd have been profitable. Not by much, but when you're swimming against the current of an 80% drop, how many long only methods would be?
A month after the bottom, when the stock was still down 36% from its peak, I'd have been up 5x my lot size. My point here is this - how much more enjoyable is trading when you don't have to fear the drops? I can tell you firsthand that I like it a LOT more than I did before. And if you couldn't tell from my description of that near -80% lot I would have been holding at the end of all that, I don't use stops.
Now I'm not gonna give away all my secrets, but I will tell you that my signaling system for this particular trade, which is a very short term mean reversion trade, involves the use of a pair derivatives of short term moving averages. I can't show them here, because they are private indicators, but they use those moving averages in a very counter-intuitive way, essentially zigging when most are zagging.
The important part, I think, isn't even really the signals. It's being willing to take money off the table when I make it rather than let the market take it back. There is an ancient saying that you can't step in the same river twice. I won't waste time explaining that, but as you can see in the chart, you CAN make the same money twice - and I do it every single day with at least one of the stocks in my portfolio. That is the secret to making money on the way down. I use constant dollar value lot sizes, so that 10 5% wins cancel out one 50% loser. When you win 9x as often as you lose, as this method does with Bloom, even in the worst of times, you make profits (or at least massively mitigate losses).
The rules from here are simple - I exit at the close of the first bar my trade is profitable. A side benefit of Bloom is that its volatility can make those wins much bigger than most stocks can. But for me, it isn't the size of the win that matters as much as stacking them over and over and over. And when this trade is done, I move my capital to the next stock with the same entry situation I have here with Bloom. And when the next signal for Bloom comes along, you can bet I will be back for more.
As always - this is intended as "edutainment" and my perspective on what I am or would be doing, not a recommendation for you to buy or sell. Act accordingly and invest at your own risk. DYOR and only make investments that make good financial sense for you in your current situation.
 Long
Long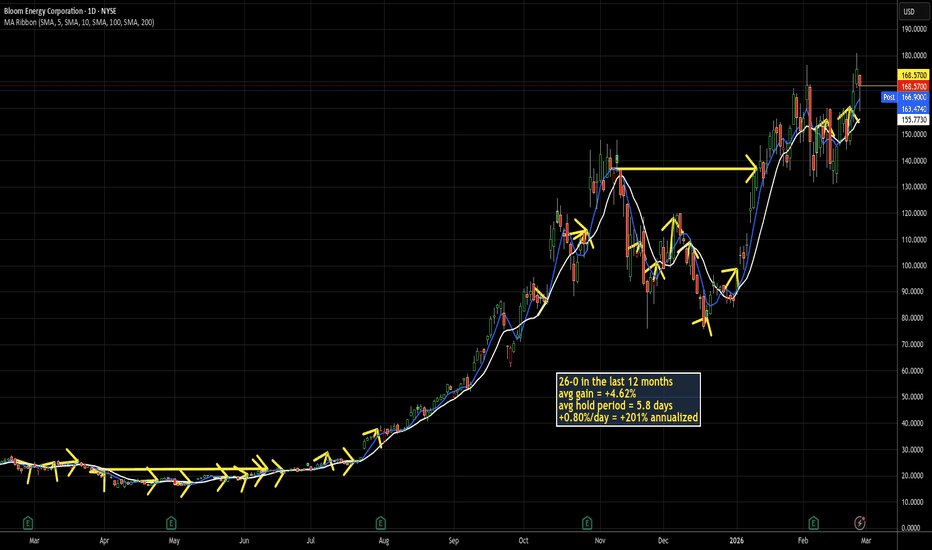
 Long
Long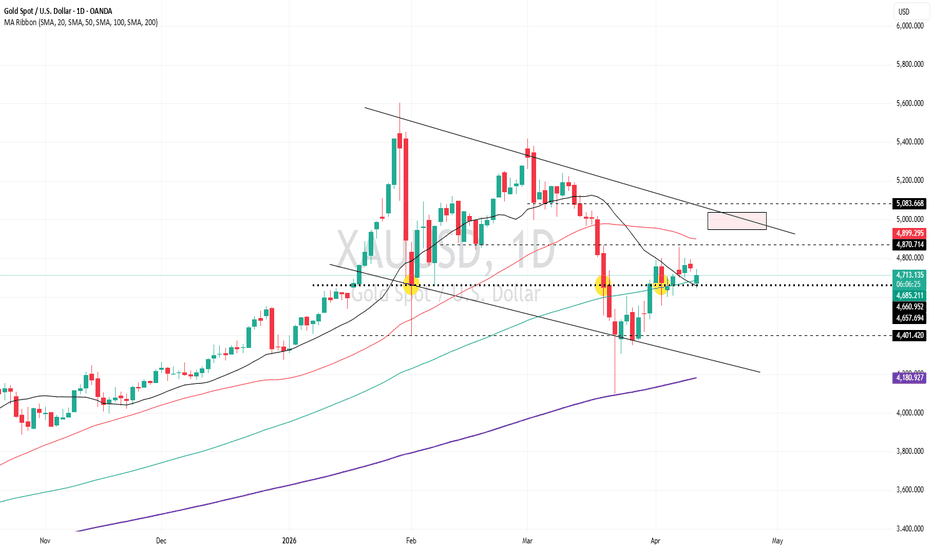
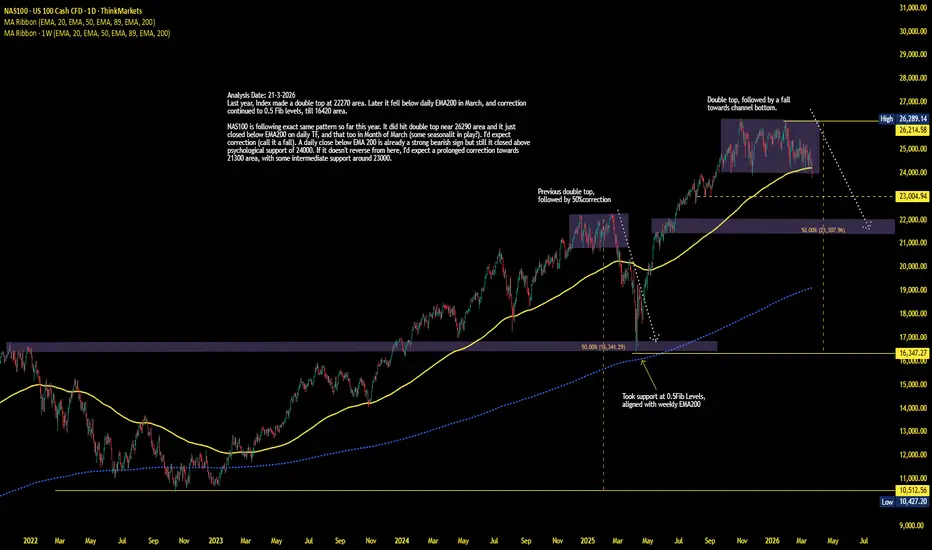
NAS100: Holding Bullish Above EMA200 — $25,004 vs $24,972█ STRUCTURE
NAS100 at $25,004 with LONG/Above/Bullish. NAS continues to outperform relative to the group, maintaining bullish structure above EMA200 ($24,972) with a $32 cushion.
After the volatile week — $25,280 high → pullback to $24,800 → recovery — NAS has stabilized above EMA200. The BoS labels on the right side confirm bullish structure is intact, though the margin is thin. Multiple EQH clusters around $25,100-25,200 show resistance above.
█ KEY LEVELS
Resistance: $25,100-25,200 (EQH / BoS cluster)
Resistance: $25,280 (swing high)
Support: $24,972 (EMA200)
Below: $24,900 / $24,800
█ CROSS-ASSET SCORECARD
XAUUSD: ⚠️ LONG / Below / Bullish — $4,720 (conflict: bullish structure, below EMA200)
BTCUSD: 🔴 SHORT / Below / Bearish — $70,739 (full bearish alignment — weakest)
EURUSD: ✅ LONG / Above / Bullish — 1.1693 (bullish but only 4 pips above EMA200)
NAS100: ✅ LONG / Above / Bullish — $25,004 (bullish, $32 above EMA200)
The group is fragmenting. BTC has fully broken down with the first Below + Bearish alignment in this tracking period. Gold is in conflict territory (bullish structure but below EMA200). EUR is barely holding above. NAS is the relative outperformer but the margin is thin everywhere.
All four assets are clustered within striking distance of their EMA200 — this compression usually precedes a decisive directional move.
Not financial advice. For educational purposes only.  Long
Long
XAUUSD: Bullish Structure Below EMA200 — Conflict at $4,720█ STRUCTURE
Gold at $4,720 with LONG/Below/Bullish. This is a conflict signal — structure has flipped back bullish but price sits below EMA200 ($4,736). The indicator is reading bullish BoS on the recovery from recent lows, but the EMA200 overhead is now resistance.
The chart tells a volatile week: $4,870 high on Apr 8 → selloff to $4,640 → recovery attempts with bullish BoS stacking → current price oscillating around EMA200. Multiple SW labels and EQH clusters show heavy two-way activity.
Price briefly reclaimed EMA200 on Apr 11 around $4,800, then lost it again with a sharp drop to $4,660 before this latest recovery.
█ KEY LEVELS
Resistance: $4,736 (EMA200 — overhead, must reclaim)
Resistance: $4,760-4,780 (BoS zone / EQH)
Support: $4,700 (recent BoS support)
Below: $4,660 (Apr 11 low)
█ WHAT TO WATCH
The "Below but Bullish" reading is unstable — it resolves in one of two ways. Either gold reclaims EMA200 at $4,736 and the bullish structure gets confirmed, or the failure to reclaim flips structure bearish again. This is the third EMA200 test in a week. The more times a level is tested, the more likely it breaks — in either direction.
Not financial advice. For educational purposes only.  Long
Long
 Long
Long
BTC 4H: Divergence Played Out, Bullish Scenario HoldsHello everyone ☀️
Interesting weekend — news, a breakout above the 72,000 level and the upper channel boundary, and we missed TP3 by just $177. Let’s break it down.
Previously, I wrote:
“If we break and hold above 72,000, the next levels are:
- 74,000 (upper channel boundary)
- 76,000 (March 17 high)”
Let’s summarize:
— Breakout above 72,000 ✅
— Upper channel boundary hit ✅ (73,823 instead of 74,000)
— Hold above 72,000 ❌
— Therefore, the 76,000 target (last of the four) is currently invalid ❌
In the previous post, I also highlighted a strong bearish divergence:
“Such conditions often lead to either a pullback or a false breakout.”
“❗️❗️❗️to work off the build-up divergence”
What we got:
— False breakout of 72,000 ✅
— Pullback ✅
— Divergence played out ✅
Conclusion:
I’ve adjusted the correction levels, but as long as price remains well above the trendline and doesn’t approach it, the current move looks like a minor local pullback — the bullish scenario remains in play 📈
⚠️ Disclaimer:
All information shared on this channel is for educational and informational purposes only and is not investment advice. The author is not responsible for your trading decisions. Always manage your risks and make decisions independently. Long 
$EURUSD - $1.18 as a decisive levelHi guys! 👋
🔔 EURUSD is at 1.1690 and the market is stuck. It bounced hard off the March lows at 1.1407, gained over 200 pips in a week when the ceasefire headlines hit, and now it's sitting right under the one level that matters — 1.1820.
🔔 Break it and hold it, this goes to 1.2000 and potentially 1.2500. Can't break it, and 1.1200–1.1180 becomes the next stop.
🔔 What followed in early 2025 was a strong impulsive move — clean, fast, technically valid — that broke price above the mid-range of the triangle and ran all the way to 1.2000. That impulse matters.
🔔 The problem is the ascending broadening wedge sitting on top of it. Higher highs, higher lows, but the boundaries are expanding not tightening.
🔔 The MA50 crossed below the MA200. That's a Death Cross, it's confirmed, and it's sitting right where price is trading now. You're basically trading inside the moving average cluster, which means every candle from here is a fight between the bulls trying to reclaim it and the bears defending it.
🔔 The 50% level is where the market tends to find genuine buyers after a corrective move, and the bounce off it has been real. The question is whether that bounce has enough behind it to take out 1.1820 or whether it fades into the moving average cluster and rolls over.
Bias : Retest $1.182 and go down to $1.11
Invalidation : If closes above $1.182, which will lead to another jump to $1.20
✊ Good luck with your trades! ✊
• If you like the idea, hit the 🚀 button
• Please ✍️ your thoughts in the Comments section
• And follow me for more updates.
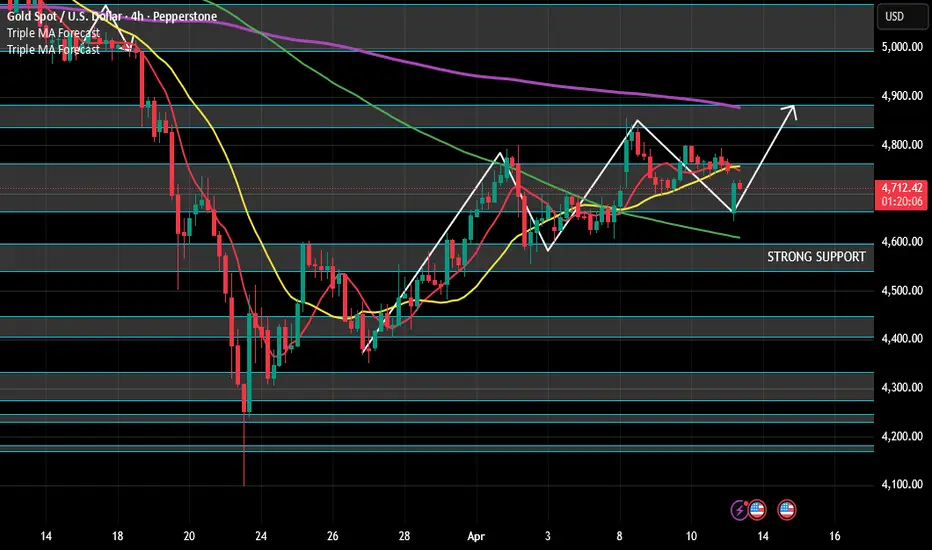
XAUUSD ADVANCED ANALYSIS – 13 APR 2026Gold opened the week with a gap-down, but structurally this move is not a reset — it is more consistent with a liquidity sweep and rebalancing phase after the previous impulsive move.
On H4, price is transitioning from a corrective downtrend into early accumulation, holding above the 4,580 – 4,620 demand zone while repeatedly rejecting lower prices.
Key observation:
➡️ The market failed to continue selling after the gap.
➡️ This suggests absorption of supply, not continuation.
We are now likely inside a re-accumulation range, preparing for expansion.
🧠 Market Structure & Flow
• Previous phase: Strong bearish impulse → exhaustion
• Current phase: Sideways compression (range formation)
• Liquidity behavior:
Sell-side liquidity already taken (below 4600)
Now building buy-side liquidity above 4750–4800
• Moving averages (dynamic structure):
Price reclaiming short-term EMA cluster
Higher timeframe MA still acting as overhead pressure
➡️ Conclusion:
Market is in transition, not trend confirmation yet.
🎯 PRIMARY TRADING PLAN – Accumulation Buy
We are positioning for rebalancing toward premium zones
Entry Zone 1 (Refined Demand):
4620 – 4660
Entry Zone 2 (Deep Liquidity Sweep):
4580 – 4610
Stop Loss:
Below 4545 (structure failure + acceptance below demand)
Take Profit Targets:
TP1: 4750 (internal liquidity)
TP2: 4820 (range high)
TP3: 4880 – 4920 (major supply / inefficiency fill)
🔁 ALTERNATIVE PLAN – Distribution Breakdown
This scenario activates only if demand fails to hold
Trigger:
H4 close below 4550 with continuation
Entry:
Retest 4550 from below
Targets:
4480 → 4420 → 4350
➡️ This would confirm the gap as true continuation, not manipulation.
📌 KEY STRUCTURAL LEVELS
Premium (Sell Zone):
4800 – 4920
Equilibrium (Decision Zone):
4700 – 4750
Discount (Buy Zone):
4580 – 4660
Extreme Support:
4520 – 4550
⚠️ EXECUTION NOTES (Important)
• This is not a trending market yet — avoid breakout chasing
• Best positioning comes from discount accumulation, not momentum entries
• The gap created emotional imbalance, which smart money exploits
• Confirmation > prediction — wait for reaction at zones
🧩 Key Read (What Most Traders Miss)
Most traders will interpret the gap as bearish continuation.
But the lack of follow-through selling tells a different story:
➡️ If sellers were truly in control, price would not stall here.
➡️ The market is absorbing, not distributing (for now).
🧠 Risk & Psychology
• This is a patience market, not a chase market
• Accept partial entries — don’t need perfect bottom
• Manage risk strictly — structure is still in transition Long 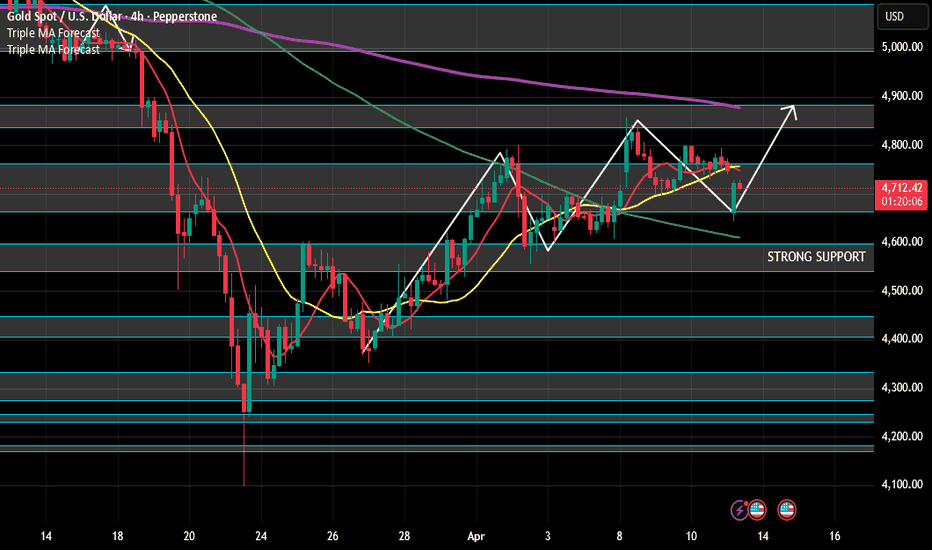
Bitcoin Short 2/2/2026 - Too Many GapsSimple, obvious intraday trade set up here.
Relatively equal highs above price action reveal a resting liquidity pool, combined with FOUR fair value gaps (two 1h, one 4h, one daily - none over 50% mitigated), provide tantalizing draws on liquidity and sufficient reason for price to move into these areas. The difficult part is finding correct entry here.
I am likely going to enter twice. The first entry will be around the 1h 100 EMA which lines up to FVG mid line levels, and FVG fill levels. This will be my insurance entry, because price could decide that's enough upside or buyers could be too weak to sustain the move, and price may move down early. My second entry is higher, resolves more fair value gaps, and uses an order as my bounce resistance.
I'm looking to enter these positions around 7am-10am EST during/around NYSE open, when liquidity and volatility is high. Short 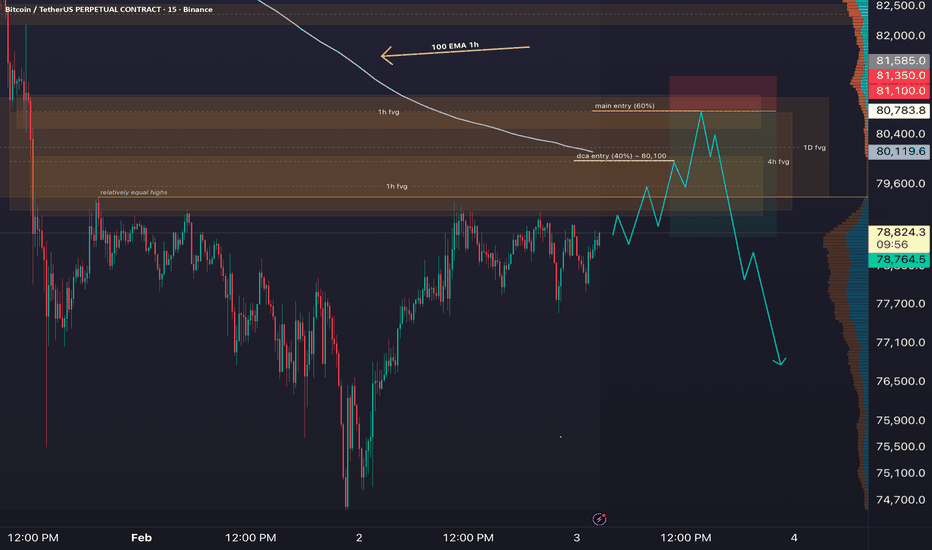
Nifty IT – Wave C Internal Structure & Global CorrelationThere is a strong possibility that the current decline is not just Wave C in progress, but we may already be entering the final leg — Wave 5 of C on lower timeframes.
The structure shows:
Accelerated downside momentum
Shallow pullbacks
Increasing impulsive behavior
This often happens in the terminal phase of a correction, where Wave 5 of C becomes sharp, emotional, and fast.
This raises the probability of:
Capitulation-style move
Quick downside expansion into key demand zones
Panic-driven selling before a potential base forms
Global Correlation – Dow Jones Impact
At the same time, the Dow Jones Industrial Average is also showing signs of initiating its own Wave C.
Rejection from Fibonacci resistance
Lower high formation
Breakdown continuation
If DJI enters a strong Wave C decline, it is typically:
Fast
High momentum
Broad risk-off trigger globally
Sectoral Impact – Indian IT Focus
A sharp correction in the US markets, especially DJI, can have a direct impact on the Indian IT sector, because:
Indian IT companies are heavily US revenue dependent
US market weakness → reduced tech spending expectations
FII outflows increase during global risk-off
This creates a high probability scenario where:
Nifty IT underperforms broader market
Selling pressure accelerates during Wave 5 of C
Stocks in IT space may see deeper corrections than index
Final Thought
If both structures align:
DJI → Wave C decline
Nifty → Wave 5 of C unfolding
Then markets could witness a synchronized sharp downside move, driven by:
Global risk-off sentiment
Liquidity unwinding
Sector-specific weakness (IT)
 Short
Short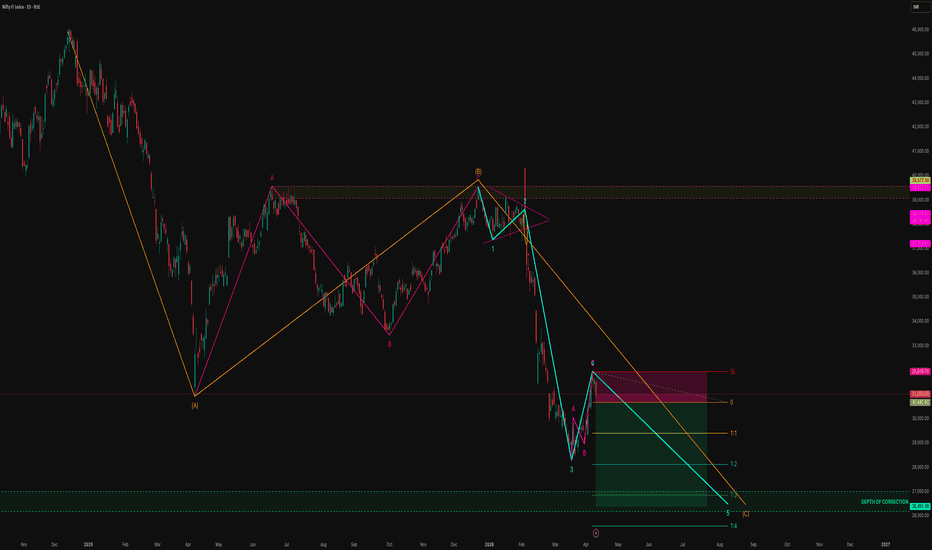
Short 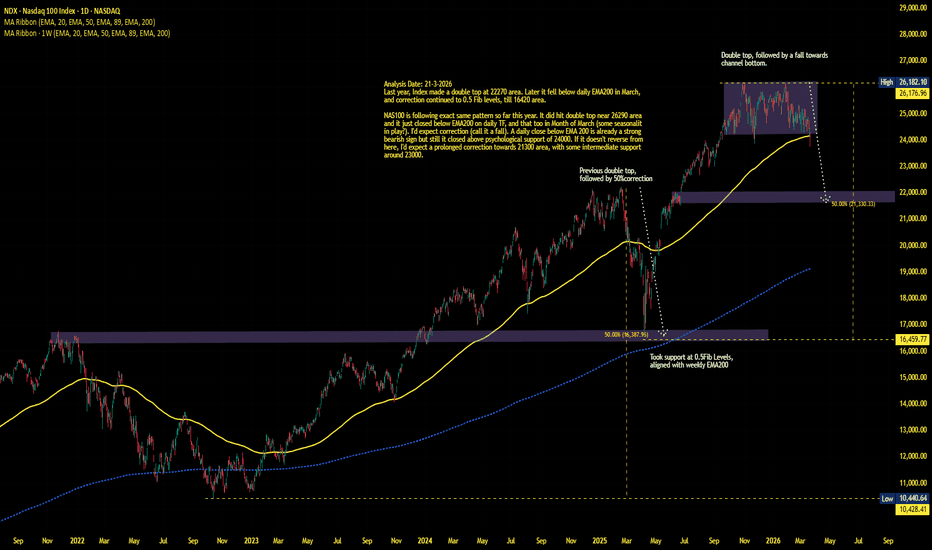
Short 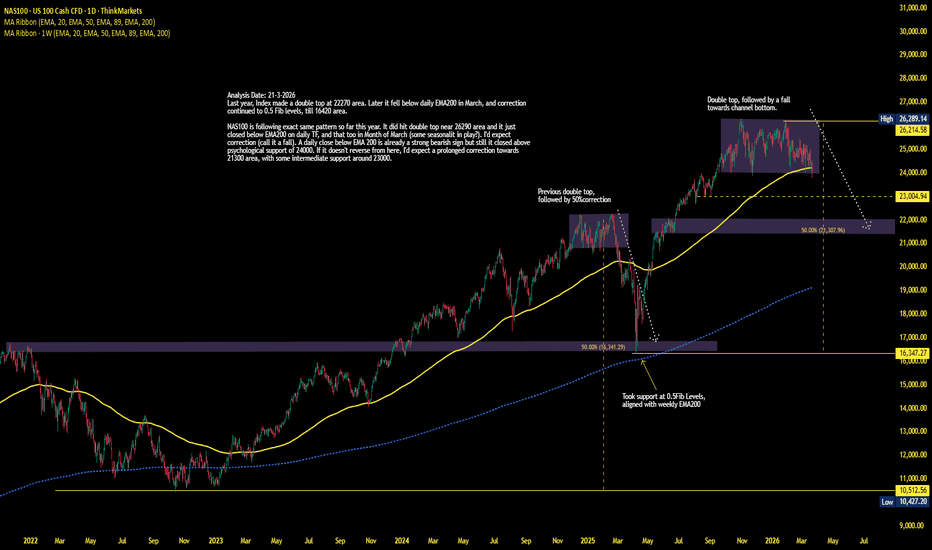
XAUUSD Faces Pressure at the Sell Zone
Gold is starting to lose momentum after testing the upper resistance layer inside the ascending structure.
The chart still shows a broader recovery from the April low, but the current reaction suggests that upside is meeting pressure at an important decision area.
Trend Pulse
The market has been trading inside a rising channel, which kept the short-term structure constructive.
However, price is now sitting right under the sell zone and close to descending trendline pressure, which makes this area critical for the next move.
This means the bullish recovery is still visible on the larger intraday structure, but the immediate momentum is weakening as price struggles to push through resistance.
Key Price Territories
The chart gives a very clean map:
Sell zone: around 4,750 - 4,760
Support strong: 4,697
Mid support: 4,608
Sell-side liquidity: 4,554
Major downside target / liquidity strong: around 4,480
As long as gold remains below the current sell zone, the market is vulnerable to a corrective pullback.
Structure Read
This setup looks like a market reaching exhaustion near resistance rather than building a fresh breakout.
The projected path on the chart suggests that if sellers defend the current zone, price may rotate lower in stages:
first into 4,697
then toward 4,608
and potentially into the 4,554 - 4,480 liquidity pocket if downside pressure expands
That keeps the short-term bias more cautious, even though the larger recovery channel is not fully broken yet.
Jasper’s Take
Gold is trading at a technical decision point.
The broader rebound structure is still visible, but the current price action shows hesitation directly under resistance.
That makes the 4,750 - 4,760 area the key zone to watch.
If price fails there, the chart favours a deeper retracement toward lower support.
Only a clean break above the sell zone would weaken the immediate bearish correction scenario.
Main levels to watch:
Resistance: 4,750 - 4,760
Support: 4,697
Lower support: 4,608
Liquidity below: 4,554
Major downside zone: 4,480
For now, the cleaner read is simple:
gold is testing resistance, and unless buyers reclaim the sell zone with strength, the market may rotate lower before any new bullish expansion appears. Short 
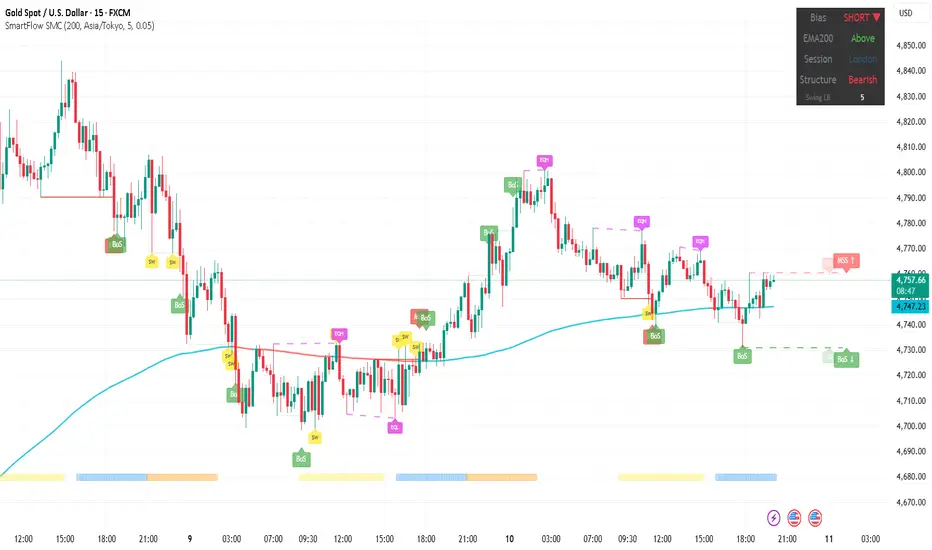
XAUUSD: Structure Flipped Bearish — $4,757 Still Above EMA200█ STRUCTURE
Gold at $4,757 with SHORT/Above/Bearish. A significant change from yesterday's bullish reading. The structure has flipped bearish while price remains above EMA200 ($4,747) — this "Above but Bearish" conflict signal is the same pattern NAS100 showed yesterday.
After yesterday's $4,870 high, the selloff deepened through $4,780 and triggered a bearish structure shift. Multiple BoS labels confirm the downtrend on 15min. Price is now sitting just $10 above EMA200 — extremely tight.
The chart shows a clear sequence: BoS down from $4,800 → failed recovery attempts around $4,780 → continued lower highs → current BoS below $4,740 area.
█ KEY LEVELS
Resistance: $4,780 (recent BoS zone, EQH cluster)
Support: $4,747 (EMA200 — immediate)
Below: $4,720 / $4,700
█ WHAT TO WATCH
EMA200 at $4,747 is the line in the sand. Yesterday it was being tested — today the structure has already flipped bearish above it. If EMA200 breaks, it confirms the bearish structure with a clean below + bearish alignment. If it holds and price reclaims $4,780, the bearish flip was a fake-out.
Not financial advice. For educational purposes only. Short 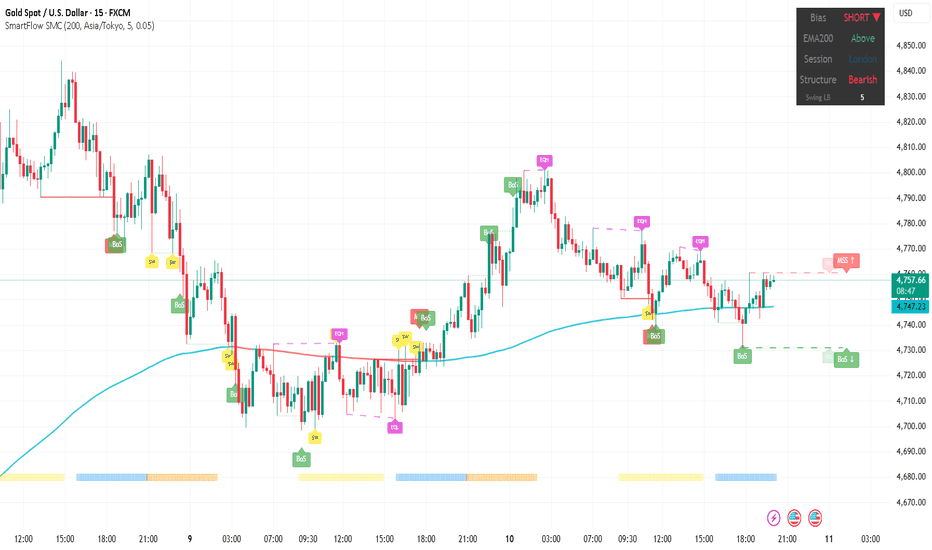
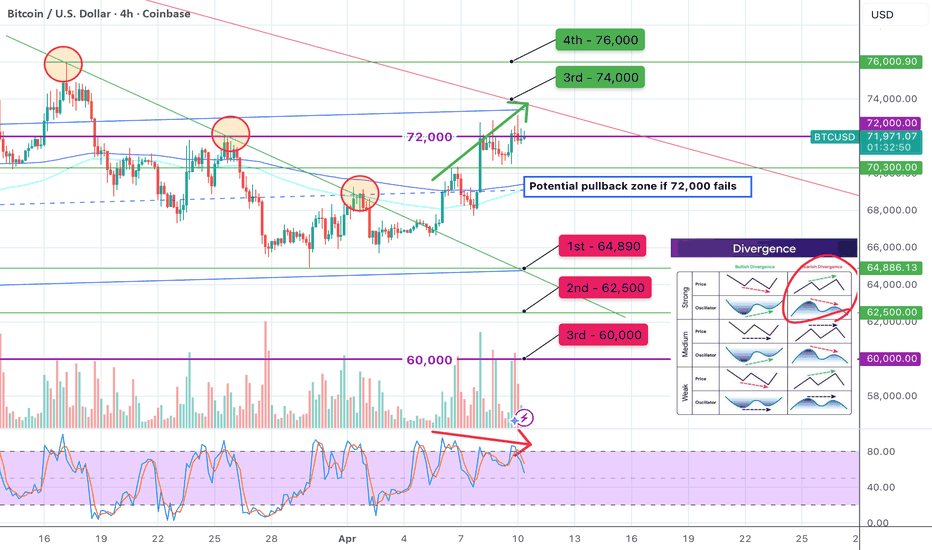
BTC at 72K — Breakout or Divergence Reset?Good morning everyone!
Let’s guess in one try — where is Bitcoin stuck?
That’s right… 72,000 🤡
We’ve seen 11 attempts to break this level in the past 48 hours,
all while a bearish divergence is building.
📈🧐 A bit of classic technical analysis
Classic TA suggests that multiple tests of a level tend to weaken it.
With each test, part of the sell-side liquidity gets absorbed.
Over time, fewer orders remain, which increases the probability of a breakout.
In our case, this is clearly reflected by the long wicks above 72,000 — the level is being actively “eaten”.
📉🥹 But there’s a catch — divergence
⚰️ Bearish divergence signals weakening momentum, and this is something that shouldn’t be ignored on higher timeframes.
Price continues to make higher highs,
while the oscillator does not — forming lower highs instead.
This suggests that buyers are still pushing price higher,
but with decreasing strength.
Such conditions often lead to either a pullback or a false breakout.
⚖️🙃 Conclusion
As mentioned in my previous posts:
“If we fail to break 72,000, a pullback toward 68,700 is likely (EMA 100 & 200 zone marked on the chart)” — ❗️❗️❗️ to work off the built-up divergence.
“If we break and hold above 72,000, the next levels are:
- 74,000 (upper channel boundary)
- 76,000 (March 17 high)”
Trade safe✌🏽 Long