NVDA: Higher Highs, Higher Lows, Higher ProbabilityNVDA - CURRENT PRICE : 224.36
HIGHER HIGHS CONFIRM THE TREND. HIGHER LOWS CREATE THE OPPORTUNITY.
This is NVIDIA's year-to-date daily chart, and the price action continues to paint a bullish picture. Since establishing its late-March low, NVDA has developed a well-defined sequence of higher highs and higher lows, which is one of the clearest characteristics of a healthy uptrend. Rather than showing signs of weakness, the stock continues to attract buyers during pullbacks, allowing the bullish structure to remain intact.
What makes the current setup particularly attractive is that the latest rebound emerged from another higher-low area. Instead of chasing price near the highs, buyers stepped in during a controlled retracement, suggesting continued confidence in the broader uptrend.
Momentum also supports the bullish narrative. During both recent pullbacks, the RSI successfully found support around the 50 level before turning higher again. In strong uptrends, RSI often treats the 50 zone as a dynamic support level, and repeated rebounds from this area indicate that bullish momentum remains healthy rather than fading.
The combination of a higher-high, higher-low market structure and RSI support near 50 creates a favorable buy-the-dip environment. As long as NVDA continues to respect these higher lows, the probability favors trend continuation rather than trend reversal.
Strong trends rarely move in a straight line. They advance, pull back, find support, and then continue higher. For trend-following traders, those pullbacks often provide the best opportunities to participate in the next leg of the move.
ENTRY PRICE : 220.00 - 224.36
FIRST TARGET : 240.00
SECOND TARGET : 256.00
SUPPORT : 208.00  Long
Long
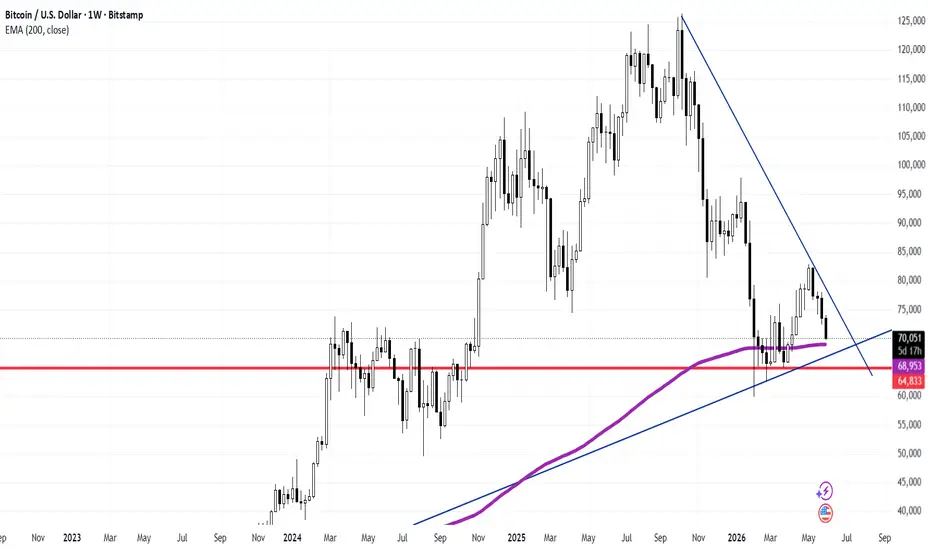
Bitcoin Weekly: BTC Tests Critical Major Confluence at the WeeklBitcoin ( BITSTAMP:BTCUSD - Bitstamp) is presenting an incredibly significant macro structural test on the Weekly (1W) chart. As long-term technical analysts, this is the exact type of high-probability confluence block we monitor for primary trend definitions.
Following a prolonged corrective cycle from its macro peaks, price action has compressed into a critical multi-layered demand territory.
### Key Macro Technical Factors:
* **The Weekly 200 EMA Baseline (68,953):** The dynamic purple baseline represents the 200-period Exponential Moving Average on the weekly timeframe, currently tracking at **68,953**. Historically, the Weekly 200 EMA serves as one of the most respected institutional floors in Bitcoin's history, acting as a definitive boundary between macro regimes.
* **The Horizontal Support Floor (64,833):** Directly beneath the dynamic average lies the vital structural support wall marked by the horizontal red line at **64,833**. This area represents a major historical liquidity pocket where long-term buyers have historically defended aggressive distribution.
* **The Trendline Compression Squeeze:** Price action is entering the final apex of a massive structural triangle, squeezed between the dominant descending macro trendline (upper blue LTB) and the primary ascending trendline (lower blue LTA).
### Strategic Outlook & Market Implications:
The intersection of the Weekly 200 EMA, the horizontal demand wall at 64,833, and the multi-month trendlines creates an exceptionally strong technical cluster.
* **The Bullish Defense Setup:** Because this zone represents deep institutional value, a clean weekly close showing deceleration (such as long lower rejection wicks or a bullish engulfing pattern) will confirm that the smart money is absorbing the supply, establishing a solid launchpad for the next macro expansion leg.
* **Risk Management Caution:** Conversely, any decisive weekly candle acceptance below the 64,833 support floor would invalidate this immediate accumulation thesis, opening the path for a deeper structural correction.
### Professional Execution Plan:
Chasing short positions directly into a rising weekly 200 EMA and historical horizontal support carries a highly unfavourable risk-to-reward ratio. The professional playbook requires monitoring lower timeframe structures (Daily or H4) inside this current high-value cluster, waiting for verified accumulation patterns or structural shifts (CHoCH) to position alongside primary institutional order flow.
---
📊 **ProData Chart** | By Rogerio Zaglia
*Macro Technical Analysis & Global Asset Research.*
⚠️ **Disclaimer:** For educational and informational purposes only. This study does not constitute financial advice or an investment recommendation. Past performance is not indicative of future results.  Long
Long
 Long
Long
 Long
Long
 Long
Long
PATH - Hits Previous Targets, Fresh Buy Signal ActivatedPATH - CURRENT PRICE : 13.10
My previous PATH buy call has successfully achieved both upside targets. For those interested in reviewing the earlier analysis and setup, the previous report link has been shared for reference.
Following the recent price action, PATH has generated another bullish technical setup. The stock has decisively broken above its sideway consolidation resistance, signaling renewed buying interest after several months of accumulation. More importantly, the breakout occurred together with a move above the EMA200, which often indicates a potential shift from a bearish trend to a bullish trend.
Momentum indicators are also supporting the bullish outlook. The MACD has crossed higher and continues to expand positively, suggesting strengthening upside momentum. In addition, the breakout was accompanied by increased volume, indicating participation from buyers rather than a low-conviction move.
As long as PATH remains above the support level at USD11.20, the bullish bias remains intact. The first upside target is USD15.00, while the second target is USD17.00, representing the next major resistance zones on the chart.
Overall, the successful breakout above both the sideway resistance and EMA200, combined with improving MACD momentum, suggests PATH may be entering a new medium-term uptrend phase. Traders may consider maintaining a bullish stance while the stock holds above the USD11.20 support level.
ENTRY PRICE : 12.80 - 13.10
FIRST TARGET : 15.00
SECOND TARGET : 17.00
SUPPORT : 11.20  Long
Long
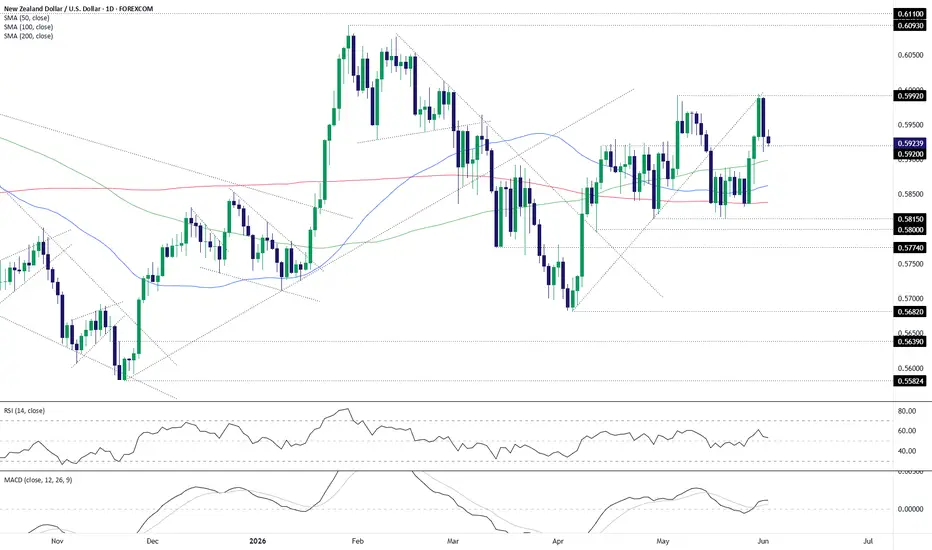
One Level, Two Kiwi SetupsNZD/USD has reversed hard from resistance at .5992 following last week’s hawkish shift from the RBNZ, sending the pair back towards support at .5920. That provides a decent level to build setups around depending on how the near-term price action evolves.
Should the Kiwi find support at .5920, as was the case on Monday, longs could be set with a tight stop beneath for protection, targeting a retest of resistance at .5992.
However, should we see a close beneath .5920 or a definitive downside break, shorts could be set with a tight stop above for protection, targeting the 200-day moving average where the pair attracted buying repeatedly in May.
The 100-day moving average, located between the entry zone and target, warrants respect given the price has interacted with it repeatedly in recent weeks. Should the price stall there, traders may want to consider nixing the trade.
Both RSI (14) and MACD marginally favour long setups over shorts, although the overall message from both indicators is more neutral than anything. As such, the price action around the important .5920 level is arguably a better tell on where directional risks may lie.
Good luck!
DS
 Short
Short
 Long
Long
 Long
Long
 Long
Long
Day 68 of 90 — Follow the Trend, Not the Noise🛡️ Day 68 of 90 — Follow the Trend, Not the Noise
XAUUSD | M15 | Sentinel Core | Sentinel Structure | Sentinel Companion
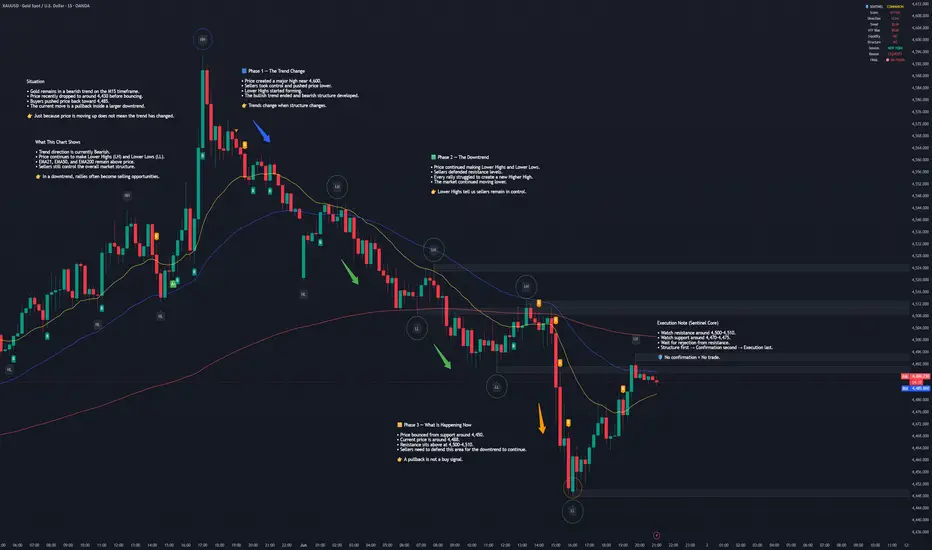
Situation
• Gold remains in a bearish trend on the M15 timeframe.
• Price dropped sharply from the 4,600 area to around 4,450.
• Buyers stepped in and pushed price back to around 4,488.
• The current move is a pullback inside a larger downtrend.
👉 Just because price is moving up does not mean the trend is bullish.
What This Chart Shows
• Trend direction is currently Bearish.
• Price continues to make Lower Highs (LH) and Lower Lows (LL).
• EMA21, EMA50, and EMA200 remain above price.
• Sellers still control the overall market structure.
👉 In a downtrend, rallies often become selling opportunities.
🟦 Phase 1 — The Trend Change
• Price created a major high near 4,600.
• Sellers took control and pushed price lower.
• Lower Highs started forming.
• The bullish trend ended and bearish structure developed.
👉 Trends change when structure changes.
🟩 Phase 2 — The Downtrend
• Price continued making Lower Highs and Lower Lows.
• Sellers defended resistance levels.
• Every rally struggled to create a new Higher High.
• The market continued moving lower.
👉 Lower Highs tell us sellers remain in control.
🟨 Phase 3 — What Is Happening Now
• Price bounced from support around 4,450.
• Current price is around 4,488.
• Resistance sits above at 4,500–4,510.
• Sellers need to defend this area for the downtrend to continue.
👉 A pullback is not a buy signal.
Key Lesson
Many traders see green candles and think the market is turning bullish.
The problem?
The overall trend is still bearish.
Professional traders focus on the bigger picture.
As long as Lower Highs continue to form, sellers remain in control.
The trend remains bearish until structure proves otherwise.
Execution Note (Sentinel Core)
• Watch resistance around 4,500–4,510.
• Watch support around 4,470–4,475.
• Wait for rejection from resistance.
• Structure first → Confirmation second → Execution last.
🛡️ No confirmation = No trade.
Trend Summary
🔴 Trend: Bearish
💰 Current Price: 4,488
📈 Resistance: 4,500–4,510
🛡️ Support: 4,470–4,475
⚠️ Status: Bearish Pullback — Waiting for Lower High Confirmation
Sentinel Principle
You do not trade the move.
You trade confirmed structure.
🛡️ Patience > Excitement
Series Note
Building consistency through observation, not prediction.
#XAUUSD #Gold #PriceAction #MarketStructure #SentinelCore #Intraday #Scalping #TradingView  Long
Long
 Long
Long
 Long
Long
 Long
Long
PATH - Bullish Divergence Near 52-Week LowPATH - CURRENT PRICE : 10.27
⚠️ PATH still remains in a broader bearish structure as price continues trading below the EMA200, showing the long-term trend is still weak. However, the interesting part here is the stock is starting to stabilize near the 52-week low area around USD9.20–9.30, which previously acted as a strong support zone. Recent candles also show buyers stepping in aggressively whenever price dips into this region.
Another positive sign is the bullish divergence on RSI. While price made a lower low recently, RSI formed a higher low, suggesting selling momentum is weakening. Volume also started to improve near the support zone, which may indicate accumulation activity is slowly building.
As long as PATH holds above the key support at USD9.20 (14 May candle low), a technical rebound remains possible. First upside target is around USD11.40, while the second target is near USD12.40, slightly below the EMA200 resistance area where selling pressure may reappear.
Overall, this is still a counter-trend recovery setup inside a bearish trend, so risk management remains important. A strong breakout above EMA200 would be needed later to confirm a larger trend reversal.
ENTRY PRICE : 10.00 - 10.27
FIRST TARGET : 11.40
SECOND TARGET : 12.40
SUPPORT : 9.20 Long 
Reports of NVDA's death have been overstated - long at 214.86It's been a while since I've posted an idea for NVDA. I've traded it a bunch since then, but I like to have something a little extra on my side if I'm going to post, and today I do.
I am an unabashed quant. I play the numbers more than I play the technicals, though my signals are technical-based. For those interested in some simple technicals, I'll drop those first.
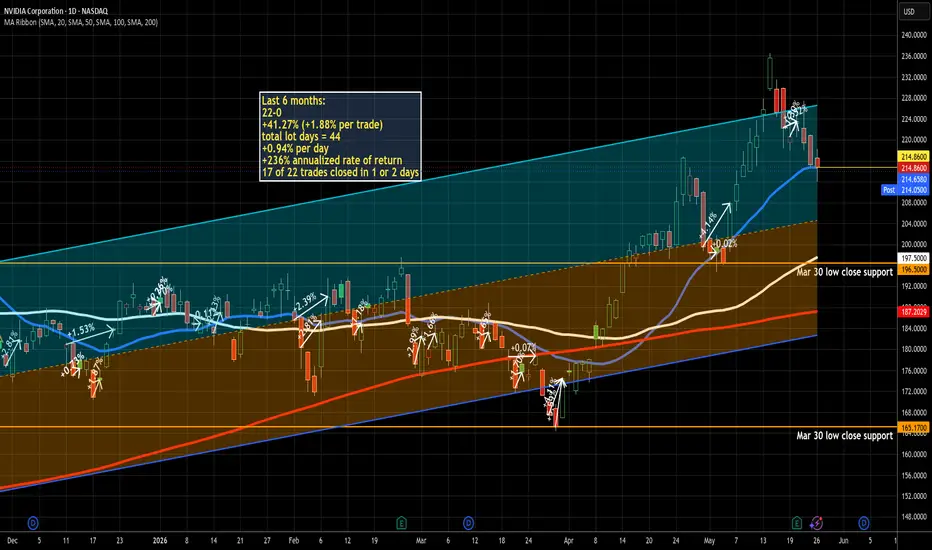
1) 6 month uptrend
2) 2 levels of support, 1 nearby shown on the chart
3) resting right on its 20d MA and above both its 50 and 200d MAs
Now for the fun part for me. Today is the second consecutive oversold signal for me. In the last 4 years, that has resulted in a win every time, with the longest holding period being 9 trading days. You have to go back to 2022 to find one that didn't pay that fast - and if you remember 2022, NVDA was not alone in that drop. More than half of these trades paid in one day.
Also, in the last year, after 3 consecutive down days, the longest it has taken to get back to green is, you guessed it - also 9 trading days. The most common result? Also anticlimactic - 1 day.
There's my case. I have never had a losing trade on NVDA. I suppose it could happen with this one, but I doubt it. It would have to go to zero for that to happen.
I will add and subtract tactically if the trade extends beyond day 1. Also, if I can get a 2% gain in the first day intraday, I will sell then and not look back. That would be an above average trade. Otherwise, any level above that .94% per day is fair game for me and I will close on the first profitable close, regardless of the size of the gain.
As always - this is intended as "edutainment" and my perspective on what I am or would be doing, not a recommendation for you to buy or sell. Act accordingly and invest at your own risk. DYOR and only make investments that make good financial sense for you in your current situation.
Long 
USDJPY Daily: Educational Case Study on the Power of the 200 EMAIn this technical analysis case study, we analyze the U.S. Dollar / Japanese Yen ( FX:USDJPY ) on the Daily Chart to visually demonstrate the immense structural power of the 200-period Exponential Moving Average (EMA 200) when combined with a major Ascending Trendline (LTA).
As technical analysts and institutional traders, we must always respect these critical macro intersections. The market's memory at these specific zones offers some of the highest-probability setups in professional trading.
### The Anatomy of Institutional Defense (Red Circles):
The two red highlights on the chart show a repeating, textbook behavior of how smart money utilizes dynamic value layers:
1. **The First Confluence Test (Jan/Feb):** Following a steep corrective phase, USDJPY drifted lower into the apex where the rising green LTA converged with the purple EMA 200 line. Notice the immediate reaction: robust bullish rejection wicks followed by strong, institutional size green candles, signaling heavy demand absorption.
2. **The Second Confluence Test (May):** History repeated itself with absolute mathematical precision. A sharp liquidation drop swept lower-timeframe stops, checking into the exact same structural confluence zone. Once again, long lower wicks and aggressive expansion buyers stepped in right after the touch, driving the exchange rate all the way back to the major **160.635** horizontal resistance ceiling.
### Professional Takeaways:
* **The 200 EMA as an Institutional Baseline:** The 200 EMA close (purple line) is not just a lagging indicator; it acts as a macro line in the sand for funds and commercial banks to reposition within a dominant trend.
* **Confirmation via Price Action:** Watching the moving average is only half the battle. The true validation comes from the *immediate candle response after the touch*. Strong daily bullish closes following a retest confirm that the dominant buyers are actively defending their territory.
### Trading Application:
Never short blindly into a rising 200 EMA conflux, and never chase a rally when it is overextended from it. The professional edge lies in identifying these structural clusters, waiting for the dynamic retest, and executing orders alongside institutional order flow once bullish momentum is verified.
---
📊 **ProData Chart** | By Rogerio Zaglia
*Technical Analysis, Price Action & Global Macro Strategy.*
⚠️ **Disclaimer:** For educational and informational purposes only. This study does not constitute investment advice or trading recommendations.  Long
Long

 Long
Long