XAU/USD 23 November 2026 Intraday AnalysisH4 Analysis:
-> Swing: Bullish.
-> Internal: Bearish.
Bias and analysis to remain the same as analysis dated 30 June 2026.
Price did not print bullish CHoCH to indicate bullish pullback phase initiation. Price instead printed a new low followed by a bullish CHoCH
Price is currently trading within and established internal range, however, I will continue to monitor price with respect to depth of pullback.
Intraday expectation:
Price to trade up to either premium of internal 50% EQ, or
Multiple Time Frame Analysis
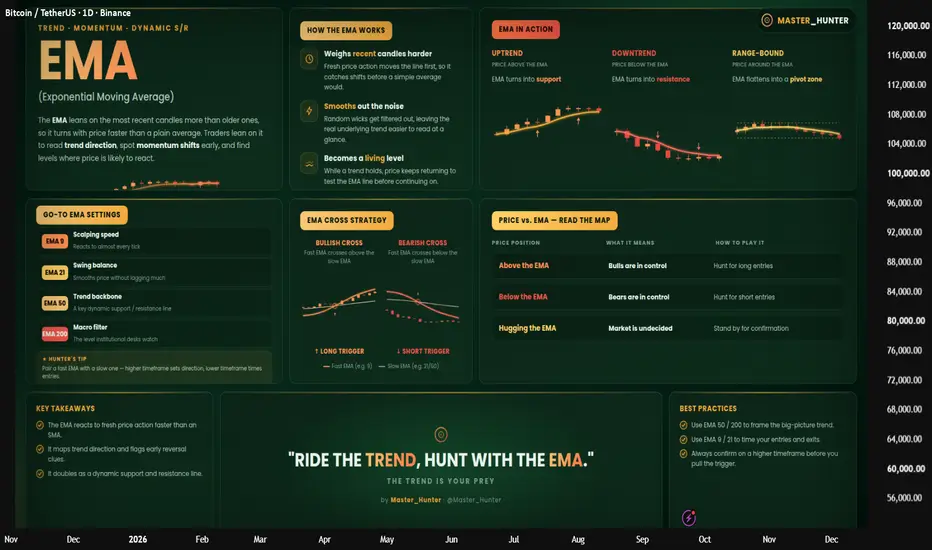
EMA Explained: How to Read Trend📌 What the EMA Actually Does Differently
A Simple Moving Average treats every candle in its lookback window the same. The Exponential Moving Average doesn't — it leans on the most recent candles, so it turns with price instead of lagging behind it. That single difference is why most active traders build their read of trend and momentum around the EMA rather than the SMA.
📊 Three Regimes, Three Jobs
Uptrend → price holds above the EMA, and the line turns into dynamic support
Downtrend
$ASTS Blasts off to the 100s again?NASDAQ:ASTS has been consolidating for some time and now has began to tighten. The Weekly timeframe is showing the MACD is gaining momentum to the upside along with the AMEX:NASA index getting a bid to start an uptrend with a higher high after a double bottom flashing on the daily chart.
70c Jan
Momentum Must AgreeGBPUSD
Price had closed positions early due to momentum not being in agreement with structure.
Now looking like price may be seeking deeper mitigation within a deeper POI, inside the major range after taking out the large liquidity pool and reaching into discounted territory.
Until then, I’m just waiting and chilling until price and momentum align with each other.
No need to force anything.
Patience is key. Tracking remains the edge.
Let’s go.
Crude Oil: Nested Structure?⏱️ Reading Time: ~3 minutes
From an Elliott Wave perspective, crude oil appears to have entered a large corrective structure following Wave (I). At this stage, the broader correction is being considered as Wave (II).
However, recent price action raises an important possibility: the market may be developing a nested structure across multiple degrees within this correction.
Bullish Scenario
Under the first scenario, the current structure may consist of a series of nested 1-2 structures across
Gold: False Breaks, Violent Reversals and a Developing MegaphoneLast week, Gold traded mostly within a broad range, accompanied by what has increasingly become the market’s new normal: false breaks followed by violent reversals.
The most aggressive move came after the Federal Reserve’s interest-rate decision. As an initial reaction, Gold dropped approximately 1,200 pips in just 90 minutes. However, the move below support proved to be another false break. Bulls quickly absorbed the selling pressure, and Gold reversed sharply, spending the remainder of the
BTC Path Toward $96K Is Taking ShapeBitcoin has completed the $82.5K test and successfully defended the $74K support zone. Price is now approaching the key resistance once more.
A sustained breakout above $82.5K could provide the confirmation needed for further expansion toward the $95K–$97K HTF supply zone.
The structure remains valid above $73.1K.
Probability over prediction.
WESLAD Research
XAU/USD 22 September 2026 Intraday AnalysisH4 Analysis:
-> Swing: Bullish.
-> Internal: Bearish.
Bias and analysis to remain the same as analysis dated 30 June 2026.
Price did not print bullish CHoCH to indicate bullish pullback phase initiation. Price instead printed a new low followed by a bullish CHoCH
Price is currently trading within and established internal range, however, I will continue to monitor price with respect to depth of pullback.
Intraday expectation:
Price to trade up to either premium of internal 50% EQ, or
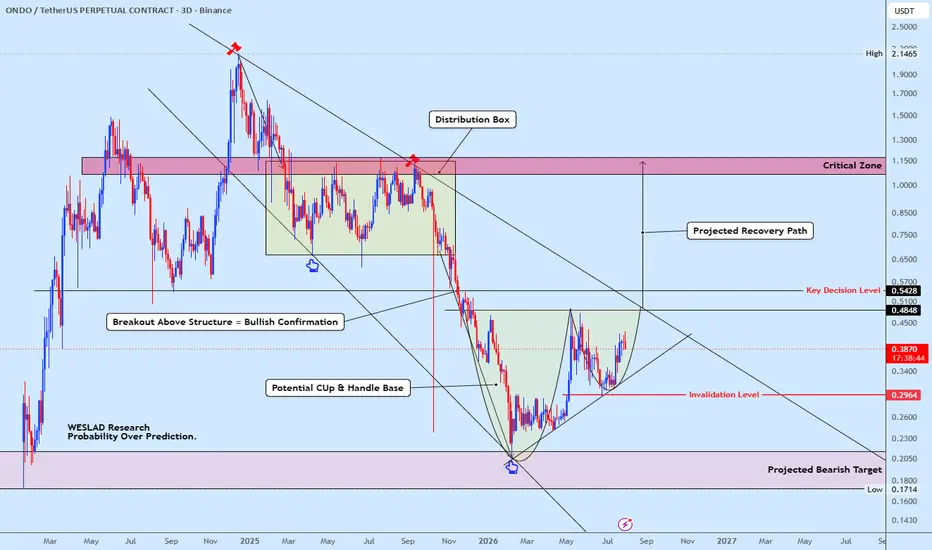
ONDOUSDT Buyers Defending Structure as Recovery Scenario BuildsONDOUSDT is developing a potential Cup & Handle base after completing an extended correction from the previous distribution phase. Price has established higher lows while respecting a key accumulation region, suggesting buyers are gradually regaining control.
The immediate focus is the key decision level around $0.54. A decisive breakout above this structural resistance would confirm bullish continuation and expose the higher-timeframe supply zone near $1.15, where significant selling pressure
USDJPY 4H: What Happens When Price Revisits Fresh DBD Supply?Market Context
On the 4-hour timeframe, USDJPY is currently trading near an identified Supply Zone .
This zone originated from a strong imbalance following a Drop-Base-Drop (DBD) structure, making the area technically relevant for studying how price behaves when it revisits a previous supply-origin region.
The zone is currently being observed as a fresh supply area , with a relatively strong leg-out and a structured basing formation.
Why This Zone Matters
A Drop-Base-Drop structure g
Episode 08 — The Architecture Behind the Waves🎬 Mr. Nobody’s Chronicle
Season I — The History of Elliott Wave Principle
Episode 08 — The Architecture Behind the Waves
⏱️ Reading time: ~3 minutes
“When we discover the language of a pattern, the next question is: How is it built?”
In the previous episode, we reached one of the most recognizable ideas behind the Wave Principle:
Five waves in the direction of the main movement...
and three waves in the corrective direction.
But one important question remained.
Do all waves have the same ch
🇪🇺🇺🇸 EUR/USD 3H | When Structure Gets Complex🇪🇺🇺🇸 EUR/USD 3H | When Structure Gets Complex, the Path Is Not Always Straight 🌀
⏱️ Reading time: about 3 minutes
Following our weekly EUR/USD analysis, we are now moving closer to the 3-hour chart to examine what the current structure may be building at the lower degree.
At this stage, the bearish scenario carries more weight, and a continuation of the downward move remains one of the important structural possibilities.
Within this scenario, the current structure may be developing as a Leadi
Silver | One Structure, Two Possible Paths⏱️ Reading time: about 3 minutes
Following our previous Silver analyses, this time we are looking at the chart from the perspective of the previous high, allowing the relationship between the larger historical structure and the current movement to become clearer.
In this view, we have been tracking a larger corrective structure from the previous high, with the possibility of a Wave IV developing. In the lower part of the chart, a Leading Diagonal followed by a Simple Zigzag has also been ident
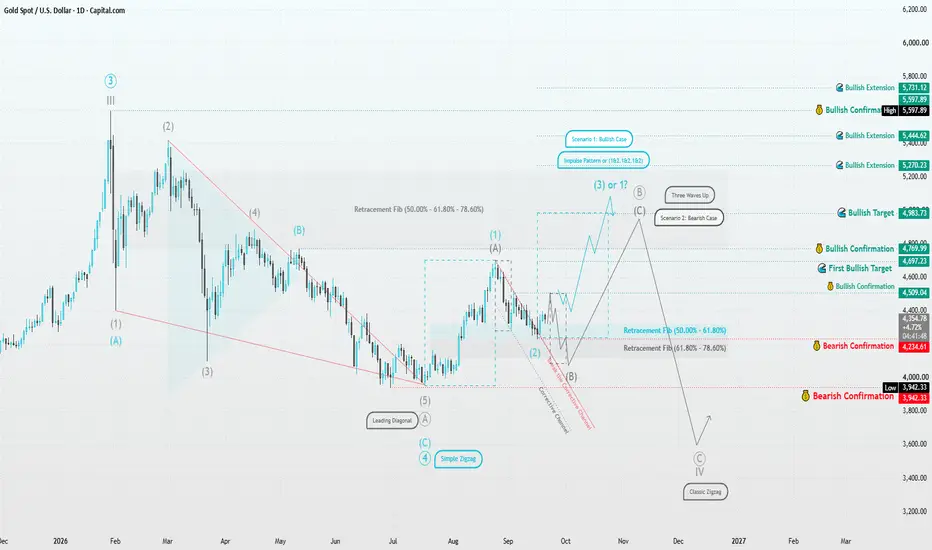
Gold | Structure Before Direction⏱️ Reading Time: ~2 minutes
In the daily timeframe, Gold’s current structure can be viewed from two perspectives. The recent move from around 3,942 may represent the beginning of a new bullish motive structure, while the current decline could potentially be Wave (2) if the 4,234–4,509 area continues to hold.
🔵 Bullish Scenario
What matters is not simply whether price rises, but whether the market develops a valid five-wave motive structure from this area. A move above 4,697, followed by 4,769
Potential Breakout in Taiwan SemiTaiwan Semiconductor Manufacturing has squeezed into a tight range for months, and some traders may think a breakout is starting.
The first item on today’s chart is the series of higher lows since July. TSM has mostly stayed under $434.16, the final price on July 2. That ascending triangle is a potentially bullish continuation pattern.
Second, the foundry giant closed $0.51 above that old resistance on Friday. It was the second-highest weekly close ever. Is the triangle resolving to the upside
DASHUSDT: Weekly Re-Accumulation and Daily Nested Wave 3 Setup⚛️
DASH is one of the stronger higher-timeframe continuation structures on my watchlist.
The weekly chart is holding the W imbalance and the 200 EMA cloud after a major reversal off the lows. That pullback did not destroy the recovery. It created a higher-timeframe re-accumulation zone, and price is now back above the key weekly EMA structure.
Relative strength is also doing its job. DASH is outperforming both BTC and ETH across the short, medium, and longer-term windows. This is not just
LTC Long-Term Reversal Is Taking ShapeLTC is developing an interesting long-term reversal structure after reacting strongly from the $39–47 support zone.
Price is now pushing higher toward the long-term descending trendline. A clean breakout and sustained acceptance above the trendline could shift the structure and bring $85.97 into focus as the first major decision level.
A successful reclaim of $85.97 could open the path toward the $130–145 supply zone, followed by the $413–420 HTF supply area.
The bullish structure remains dep
USDJPY: Confirmed Bullish Continuation 🇺🇸🇯🇵
USDJPY will likely continue recovering after a retest of the recently broken
major horizontal resistance cluster.
A double bottom pattern on an hourly time frame provides strong confirmation.
Goal - 157.6
❤️Please, support my work with like, thank you!❤️
I am part of Trade Nation's Influencer program and receive a monthly fee for using their TradingView charts in my analysis.
EURUSD | 4H Bearish Continuation — 15M POI With 3 Entry ModelsFOREXCOM:EURUSD is currently being approached through a structured multi-timeframe framework. The higher timeframe remains bearish, while the lower timeframes are being used to define the setup, location and execution.
My framework is:
4H: Structure / Phase
15M: Setup / Liquidity
5M: RC Confirmation
2M: CH Confirmation
The expectation is for price to retrace upward into the marked 15M POI.
This is the area where I want to pay attention to price action and liquidity before considering th