EURUSD | Higher-Timeframe Pullback Within a Daily Bearish TrendThe previous FOREXCOM:EURUSD analysis played out exactly as anticipated.
Price respected the Higher-Timeframe Flip Zone, produced a clean bearish continuation, and successfully reached the projected downside liquidity objective. This reinforces the importance of allowing institutional zones to dictate execution rather than chasing price.
Following that decline, however, the market began to reveal new information.
Although price swept the recent weak low, it failed to produce a decisive 4H c
Multiple Time Frame Analysis
Daily Supply Reached | Pullback Objective CompleteFOREXCOM:EURUSD has now reached and reacted from the Daily Supply Zone identified in our previous analysis, completing the higher-timeframe pullback objective we were monitoring.
In the previous analysis, the market was trading with a bearish Daily structure, while the 4H timeframe had shifted bullish. Rather than immediately looking for sells simply because the Daily bias was bearish, the plan was to allow the 4H bullish structure to facilitate a deeper pullback into the Daily Supply Zone.
T
GBPJPY 120M: What Happens When Price Revisits These Zones?Market Context
On the GBPJPY 120-minute timeframe, both a Demand Zone and a Supply Zone are being observed as important areas of market structure.
The Demand Zone originated from a Rally-Base-Rally (RBR) structure, where a quality basing phase was followed by a strong bullish leg-out.
The Supply Zone developed through a Drop-Base-Drop (DBD) structure, where a period of consolidation was followed by a strong bearish leg-out.
Why Are These Zones Technically Significant?
Both zones
Silver | Has the Structure Chosen Its Path?⏱️ Reading Time: ~2 minutes
In our previous analysis, we had two possibilities on the table: Wave IV had completed and a new bullish move was beginning, or the larger correction was still unfolding.
Now, the price structure has moved one step further and given us clearer levels to monitor for both scenarios.
🟦 Scenario 1 — Bullish Path
If the recent decline was a Wave 2, the current move could be the beginning of a new impulse.
In this case, a break and sustained move above the bullish conf
Bitcoin 2H | An Impulse at the Crossroads⏱️ Reading Time: ~3 minutes
Hey everyone,
In this 2H Bitcoin update, I’m focusing on one main question:
Is the recent bullish structure still developing as an impulsive pattern, or has that impulse already been completed and the market entered a higher-degree correction?
🟦 Scenario 1 | Bullish Case
In the bullish scenario, as long as price does not enter the territory of Wave 1, the current structure can still be considered a potential Impulse.
One interesting feature of this count is the
🇺🇸 DXY | Short-Term Strength or the Start of a Larger Move? ⏱️ Reading time: about 3 minutes
In this update, we are taking another look at the DXY structure, this time with greater focus on the behavior we are seeing from the U.S. dollar in the short term.
At the moment, significant short-term strength is visible, and price is approaching several important levels marked on the chart.
But from an Elliott Wave perspective, simply seeing price move higher is not enough for us.
The key question is:
Is this advance the beginning of a new bullish structur
BSX - Holding on for dear life... But for how long?I don't believe in "support" as one line that refuses to give. Especially not on high time frames like the monthly and daily. Instead, I see multiple efforts at a single level holding as an area that's intentionally building liquidity (i.e. tons of buyers & sellers) - to either be:
A) broken and have fuel for a continuation downward
or
B) to be tapped into and reclaimed as fuel for a reversal upward.
I see this $42.60 level as just that.
And depending on how we react when the break does com
Gold: Listening to the Structure Behind the Next Move⏱️ Reading Time: ~2 minutes
Bullish and Bearish Scenarios | Elliott Wave Principle
At the current stage, two primary structures remain under consideration. The key point is that price structure must determine which scenario gains greater validity, rather than direction alone.
🟦 Bullish Case
The market may be completing a corrective structure in the form of a Classic Zigzag, with the recent advance representing part of Wave C.
An important observation is that Wave C has so far retraced only
XAU/USD 23 November 2026 Intraday AnalysisH4 Analysis:
-> Swing: Bullish.
-> Internal: Bearish.
Bias and analysis to remain the same as analysis dated 30 June 2026.
Price did not print bullish CHoCH to indicate bullish pullback phase initiation. Price instead printed a new low followed by a bullish CHoCH
Price is currently trading within and established internal range, however, I will continue to monitor price with respect to depth of pullback.
Intraday expectation:
Price to trade up to either premium of internal 50% EQ, or
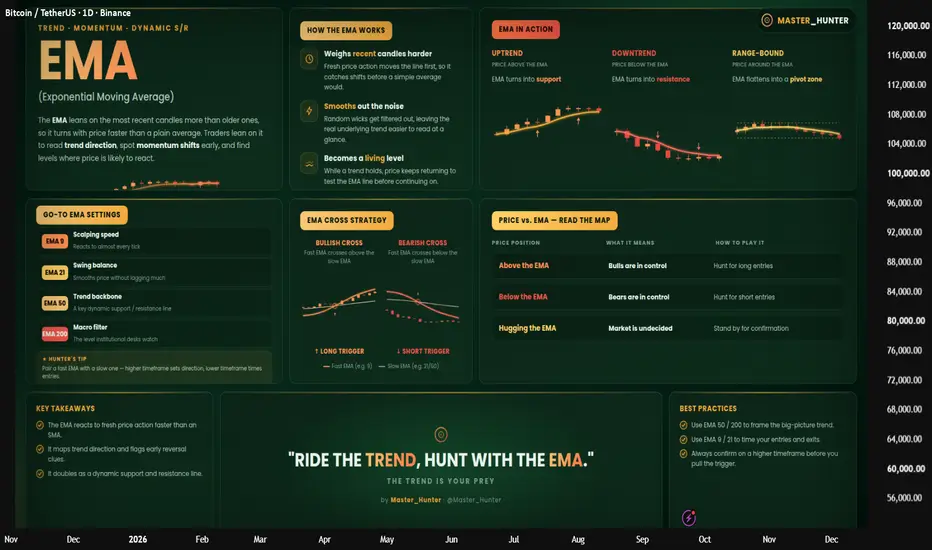
EMA Explained: How to Read Trend📌 What the EMA Actually Does Differently
A Simple Moving Average treats every candle in its lookback window the same. The Exponential Moving Average doesn't — it leans on the most recent candles, so it turns with price instead of lagging behind it. That single difference is why most active traders build their read of trend and momentum around the EMA rather than the SMA.
📊 Three Regimes, Three Jobs
Uptrend → price holds above the EMA, and the line turns into dynamic support
Downtrend
$ASTS Blasts off to the 100s again?NASDAQ:ASTS has been consolidating for some time and now has began to tighten. The Weekly timeframe is showing the MACD is gaining momentum to the upside along with the AMEX:NASA index getting a bid to start an uptrend with a higher high after a double bottom flashing on the daily chart.
70c Jan
Momentum Must AgreeGBPUSD
Price had closed positions early due to momentum not being in agreement with structure.
Now looking like price may be seeking deeper mitigation within a deeper POI, inside the major range after taking out the large liquidity pool and reaching into discounted territory.
Until then, I’m just waiting and chilling until price and momentum align with each other.
No need to force anything.
Patience is key. Tracking remains the edge.
Let’s go.
Crude Oil: Nested Structure?⏱️ Reading Time: ~3 minutes
From an Elliott Wave perspective, crude oil appears to have entered a large corrective structure following Wave (I). At this stage, the broader correction is being considered as Wave (II).
However, recent price action raises an important possibility: the market may be developing a nested structure across multiple degrees within this correction.
Bullish Scenario
Under the first scenario, the current structure may consist of a series of nested 1-2 structures across
Gold: False Breaks, Violent Reversals and a Developing MegaphoneLast week, Gold traded mostly within a broad range, accompanied by what has increasingly become the market’s new normal: false breaks followed by violent reversals.
The most aggressive move came after the Federal Reserve’s interest-rate decision. As an initial reaction, Gold dropped approximately 1,200 pips in just 90 minutes. However, the move below support proved to be another false break. Bulls quickly absorbed the selling pressure, and Gold reversed sharply, spending the remainder of the
BTC Path Toward $96K Is Taking ShapeBitcoin has completed the $82.5K test and successfully defended the $74K support zone. Price is now approaching the key resistance once more.
A sustained breakout above $82.5K could provide the confirmation needed for further expansion toward the $95K–$97K HTF supply zone.
The structure remains valid above $73.1K.
Probability over prediction.
WESLAD Research
XAU/USD 22 September 2026 Intraday AnalysisH4 Analysis:
-> Swing: Bullish.
-> Internal: Bearish.
Bias and analysis to remain the same as analysis dated 30 June 2026.
Price did not print bullish CHoCH to indicate bullish pullback phase initiation. Price instead printed a new low followed by a bullish CHoCH
Price is currently trading within and established internal range, however, I will continue to monitor price with respect to depth of pullback.
Intraday expectation:
Price to trade up to either premium of internal 50% EQ, or
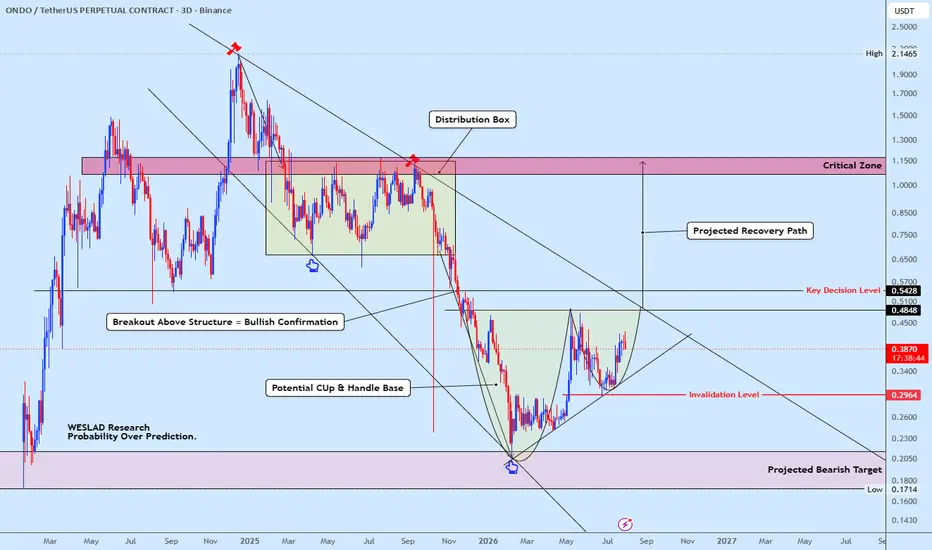
ONDOUSDT Buyers Defending Structure as Recovery Scenario BuildsONDOUSDT is developing a potential Cup & Handle base after completing an extended correction from the previous distribution phase. Price has established higher lows while respecting a key accumulation region, suggesting buyers are gradually regaining control.
The immediate focus is the key decision level around $0.54. A decisive breakout above this structural resistance would confirm bullish continuation and expose the higher-timeframe supply zone near $1.15, where significant selling pressure
USDJPY 4H: What Happens When Price Revisits Fresh DBD Supply?Market Context
On the 4-hour timeframe, USDJPY is currently trading near an identified Supply Zone .
This zone originated from a strong imbalance following a Drop-Base-Drop (DBD) structure, making the area technically relevant for studying how price behaves when it revisits a previous supply-origin region.
The zone is currently being observed as a fresh supply area , with a relatively strong leg-out and a structured basing formation.
Why This Zone Matters
A Drop-Base-Drop structure g