Short
Short
GOLD - Consolidation above 4,700...Gold is testing the downward resistance of the daily market structure. A de-escalation in the Middle East and consolidation above 4,700 could provide an opportunity for a shift in market sentiment.
Gold is holding above $2,700 amid geopolitical uncertainty and anticipation of key NFP data on the U.S. labor market. The main drivers of growth are weakening demand for the dollar and hopes for a Fed rate cut in the event of weak employment statistics. The fate of the precious metal depends on progress in U.S.-Iran negotiations and the NFP data
Technically, the dollar looks weak. The fundamental backdrop is unstable, but the weakening of the DXY and oil prices is supporting gold
Gold is consolidating within the 4,660–4,764 range; however, the market is attempting to hold above the pivot point and the key 4,700 level.
Resistance levels: 4764, 4798, 4803
Support levels: 4700, 4660, 4646
Technically, the market is in a consolidation phase within the range. Focus is on 4700 and the 4660–4646 cluster. Given the news, if the fundamental backdrop remains unchanged, the market may form a long squeeze before rising. However, if the bulls keep gold above 4700, the market will have the potential to rise to 4800–4830.
Best regards, R. Linda!  Long
Long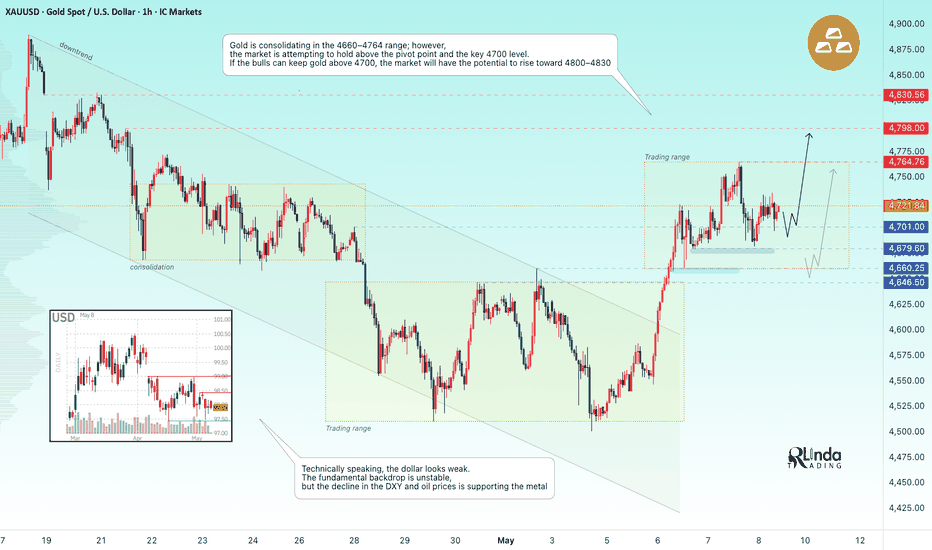
EURUSD: Rejection from Resistance Targets Lower Support LevelsHello everyone, here is my breakdown of the current EURUSD setup.
Market Analysis
EURUSD previously traded inside a downward channel, confirming bearish momentum. After breaking lower, price formed a range near support and later reversed through an inverse head and shoulders pattern, triggering a short-term recovery.
Currently, price is trading below the 1.1750 resistance zone inside a new descending channel, while holding above the 1.1630 support zone. Recent rejection from resistance confirms renewed selling pressure.
My Scenario & Strategy
As long as EURUSD remains below the 1.1750 resistance and respects the descending channel, the bearish scenario remains valid. A rejection from this area could push price toward the 1.1630 support (TP1).
However, if price breaks above 1.1750 and exits the descending channel, the bearish outlook would be invalidated, opening the path for a potential upward move.
That’s the setup I’m tracking. Thank you for your attention, and always manage your risk. XAUUSD: Escapes Bearish Channel – Long Scenario in PlayHello everyone, here is my breakdown of the current XAUUSD setup.
Market Analysis
Gold previously traded within a downward channel. After reaching a local bottom, price formed a fake breakout near the lower boundary of the channel and quickly reversed upward, signaling buyer strength and a possible trend reversal.
Currently, XAUUSD is holding above the 4,720 support zone while trading near the upper boundary of the previous bearish structure. A recent breakout and successful retest of support indicate growing bullish momentum, while price continues to recover from the descending channel.
My Scenario & Strategy
As long as XAUUSD remains above the 4,720 support zone and holds the breakout structure, the bullish scenario remains valid. A continuation higher could push price toward the 4,800 resistance zone (TP1).
However, if price breaks back below 4,720 and loses support, the bullish setup would be invalidated, opening the path for a deeper pullback.
That’s the setup I’m tracking. Thank you for your attention, and always manage your risk. Long 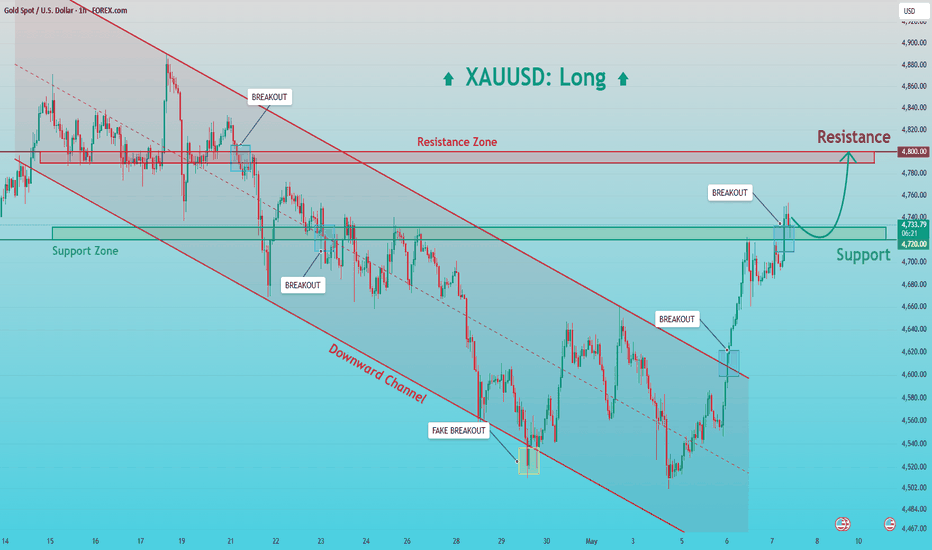
 Long
Long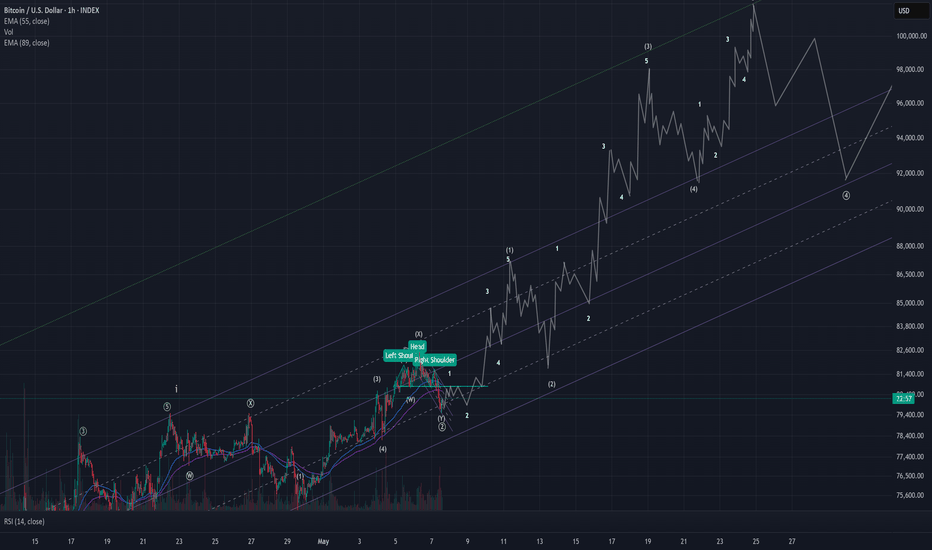
Long 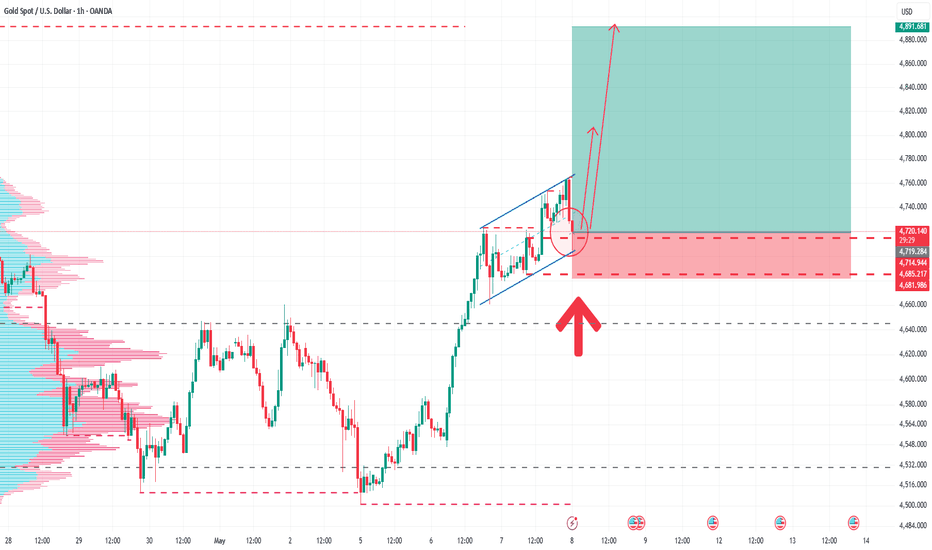
BTCUSDT: Uptrend Continues – Targeting 83K ResistanceHello everyone, here is my breakdown of the current BTCUSDT setup.
Market Analysis
BTCUSDT previously traded within an upward channel, forming higher highs and higher lows, confirming strong bullish momentum. After a brief consolidation phase inside a range, price broke out to the upside and continued its upward movement.
Currently, BTCUSDT is holding above the 80,500 support zone and approaching the 83,000 resistance zone. A recent breakout followed by a successful retest of support indicates sustained buying pressure, while price continues to respect the ascending channel structure.
My Scenario & Strategy
As long as BTCUSDT holds above the 80,500 support and remains within the ascending channel, the bullish scenario remains valid. A continuation higher could push price toward the 83,000 resistance (TP1).
However, if price breaks below 80,500 and loses the channel support, the bullish setup would be invalidated, opening the door for a deeper correction.
That’s the setup I’m tracking. Thank you for your attention, and always manage your risk. Long 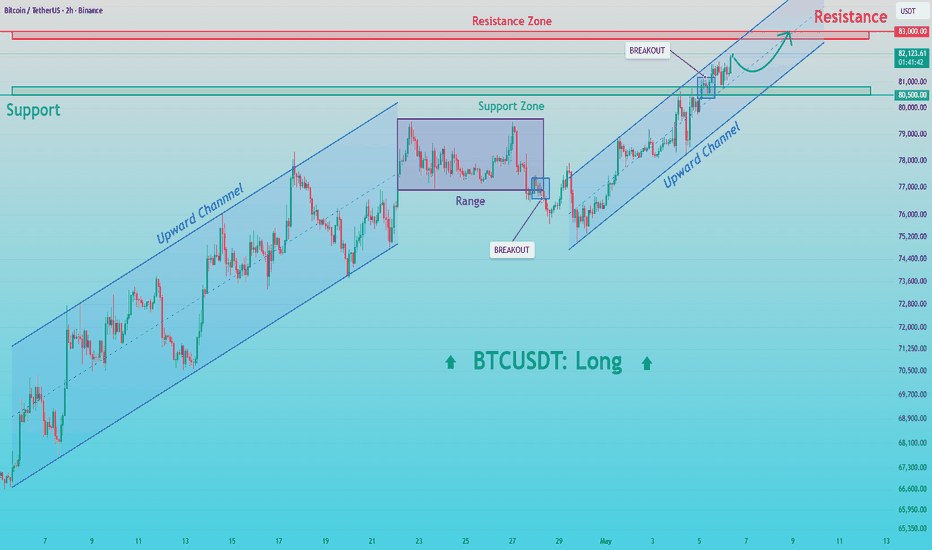
Gold Market Structure Turns Bullish – Key Levels AheadHello traders! Here is my technical outlook based on the current XAUUSD (3H) chart structure. Gold previously traded within a range before breaking down and entering a bearish phase. After reaching a local bottom, price reversed and started moving within an ascending channel, signaling a recovery phase. Currently, price is trading above the 4,630 buyer zone, which acts as strong support, while approaching the 4,800 resistance level (seller zone). A recent bounce from the ascending support line, along with multiple breakout confirmations, indicates growing bullish momentum in the short term. As long as XAUUSD holds above the 4,630 support and respects the ascending support line, the bullish scenario remains valid. A continuation higher could push price toward the 4,800 resistance (TP1). Please share this idea with your friends and click Boost 🚀 Long 
ETHUSDT - A pullback before breaking through 2400...BINANCE:ETHUSDT.P is forming a correction following a short squeeze. The altcoin is testing a key support level within its uptrend and may continue to rise. The uptrend remains intact
Bitcoin is consolidating above the 80,000 mark, having previously opened a new range of 80,000–95,000. The consolidation is forming above resistance, i.e., in the buying zone.
Accordingly, the flagship coin’s bullish momentum will support altcoin prices.
Ethereum is forming a liquidity hunt (correction) within the trading range. The correction does not break the bullish trend but gathers liquidity for a possible breakout of the consolidation resistance.
Resistance levels: 2,385, 2,398, 2,463
Support levels: trendline, 2313, 2250
If the bulls hold the price above 2315, this will confirm the formation of a local bottom and support the bullish trend. A breakout above 2400 could trigger a rally toward 2600
Best regards, R. Linda!  Long
Long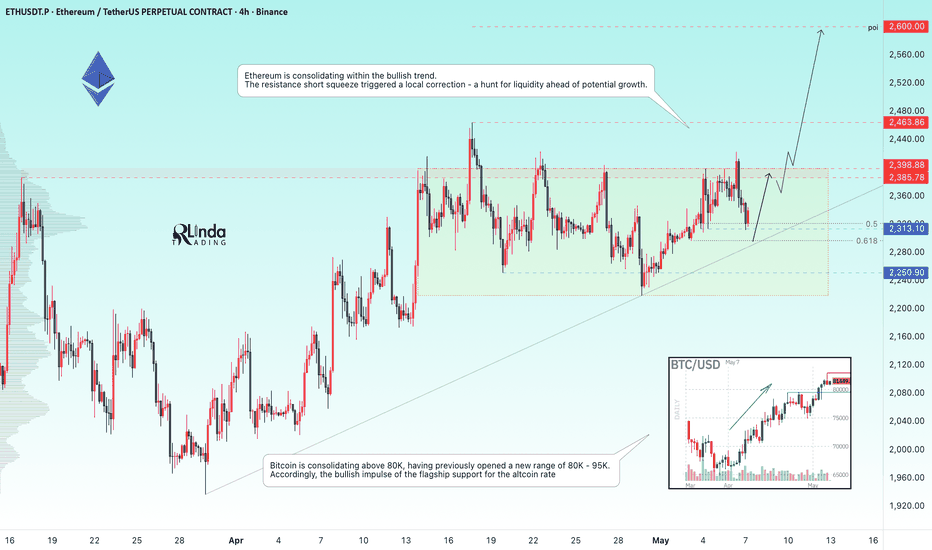
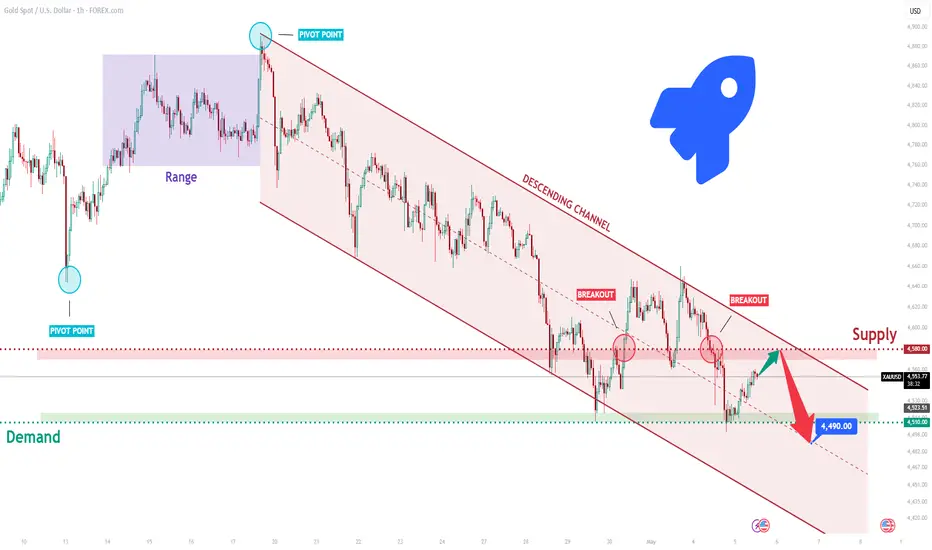
XAUUSD Short: Sellers Dominate Below 4,580, Potential Aim 4,490Hello traders! Here’s my technical outlook based on the current XAUUSD (1H) chart structure. Gold previously traded within a range, showing consolidation before reaching a pivot point at the top of the structure. From there, price reversed sharply and entered a descending channel.
Currently, XAUUSD is trading below the 4,580 supply zone, which acts as resistance, while approaching the 4,510 demand zone. Multiple rejections and breakouts inside the channel highlight strong selling pressure and continuation of the downtrend.
As long as XAUUSD remains below the 4,580 resistance and respects the descending channel, the bearish scenario remains valid. A rejection from this area could push price toward the 4,490 support (TP1). Manage your risk! Short 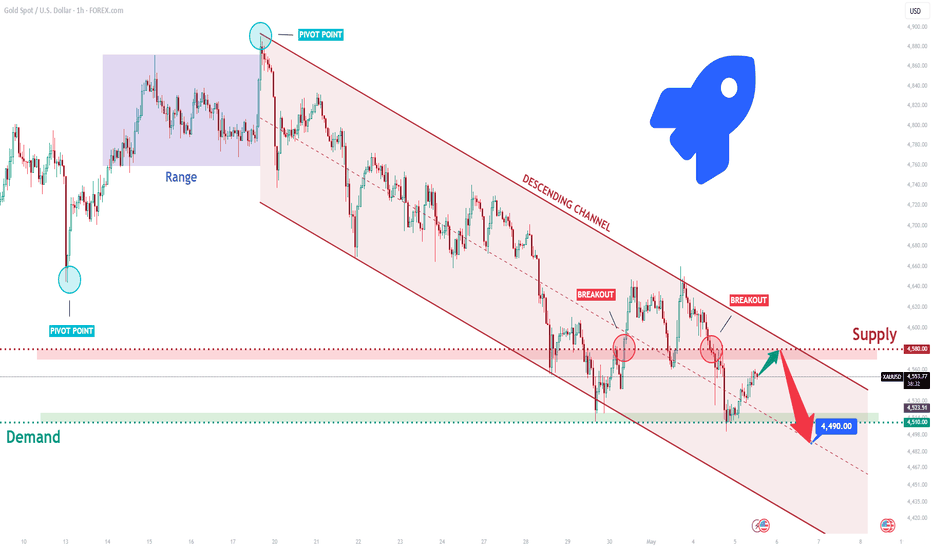
BTCUSDT Bullish Continuation Toward 82K Within Ascending ChannelHello traders! Here is my technical outlook based on the current BTCUSDT (4H) chart structure. Bitcoin previously traded under a descending resistance line. After the breakout, price established an ascending channel with higher lows, confirming growing bullish momentum. Currently, price is trading above the 78,900 buyer zone, which acts as strong support, while approaching the 81,300–82,000 resistance area (seller zone). A recent breakout from the range and continuation within the ascending channel indicate sustained buying strength. As long as BTCUSDT holds above the 78,900 support and respects the ascending channel, the bullish scenario remains valid. A continuation from this structure could push price toward the 82,000 resistance (TP1). Please share this idea with your friends and click Boost 🚀 Long 
 Short
Short
Short 
GOLD - The hunt for liquidity ahead of the fall ICMARKETS:XAUUSD is testing the 4,500 level and forming a counter-trend correction. The fundamental backdrop is weak; sellers are likely to return amid sustained demand for the dollar and renewed tensions in the Strait of Hormuz...
Since yesterday’s session, the US–Iran escalation has intensified, pushing the dollar and oil higher.
Inflation risks: An energy shock (rising oil prices) is fueling inflation, reinforcing “hawkish” expectations regarding Fed rates. The dollar is the primary safe-haven and reserve currency, which is weighing on gold.
Gold remains under pressure due to a combination of geopolitical tensions and hawkish expectations regarding Fed rates. Downside potential persists unless there are signs of de-escalation in the Strait. The key question is whether the ceasefire (in effect since early April) will collapse amid a new round of tensions within the context of a local uptrend.
Resistance levels: 4566, 4579, 4600
Support levels: 4510, 4482
Technically, a rebound from support is forming with the aim of a counter-trend retest of resistance and the liquidity zone. A short squeeze could shift the balance toward sellers and trigger a drop toward the support level of the range and the trend.
Best Regards, R. Linda!
Short 

 Short
Short