POLKADOT [$DOT] EWP TC FIB ANALYSIS WEEKLY TFPolkadot (DOT) – Expanded Flat (3-3-5) Near Completion?
DOT has been unfolding a textbook Elliott Wave expanded flat since its 2021 peak.
The initial bull market completed with a clear five-wave impulse from $1.45 to $49.82. The marginal new high at $55.18 is not counted as part of that impulse. Instead, it represents Wave B of an expanded flat correction.
The structure is as follows:
* Wave A: $49.82 → $10.38 (3 swings)
* Wave B: $10.38 → $55.18 (3 swings)
* Wave C: $55.18 → 5-wave impulse targeting 63¢
This forms a classic 3-3-5 expanded flat, one of EWP’s most common corrective patterns.
Wave C has respected the long-term descending channel remarkably well and is approaching a strong confluence of support: the lower channel boundary, Fibonacci extensions, and historical price levels all converge around the current region.
If this count is correct, DOT is in the final stages of completing a multi-year corrective structure rather than beginning a new bear market. Confirmation, however, will only come with a clear five-wave advance from the low. Until an impulsive reversal develops, further downside cannot be ruled out.
A completed expanded flat would imply that the correction of the entire advance from $1.45 has ended, opening the door to a new impulsive cycle with the potential to eventually exceed the previous all-time high.
As always, this is an Elliott Wave interpretation, not a prediction. Alternative counts remain valid until the market confirms one scenario over the others.
Like and follow for more charts like this.  Long
Long
EURUSD - Retest of support at 1.143–1.140 before distribution FX:EURUSD is showing early bullish signals. The pair is breaking above the 1.1434 resistance cluster and the descending trendline, opening the door for a potential continuation higher
The latest FOMC minutes did not deliver a clear hawkish message, with markets pricing in only a 25–30% probability of a July rate hike. Meanwhile, the 1.1400 support continues to provide a solid base for a technical rebound. However, renewed geopolitical tensions in the Middle East continue to support the U.S. dollar as a safe-haven asset
The ECB is widely expected to remain on hold in July, while the Fed still retains the option of another rate hike. Technically, the U.S. dollar is showing a limited reaction to recent news and appears vulnerable to a corrective pullback, which could provide additional support for the euro following the false breakout below support and the breakout above consolidation resistance
Resistance levels: 1.1477, 1.1528
Support levels: 1.1434, 1.1400
The pair is also confirming a false breakout below the major weekly (W1) support. The prolonged battle around 1.1400 highlights persistent buying interest. Locally, EURUSD is breaking above the 1.1434 consolidation resistance and the descending corrective trendline. If bulls can hold 1.1434 as new support, the pair could extend its advance toward 1.1478 and 1.1528
Best regards,
R. Linda U.S. Dollar / Japanese Yen ($USDJPY) Daily: Classical Elliott U.S. Dollar / Japanese Yen ( FX:USDJPY ) Daily: Classical Elliott Wave Matrix – Mapping Wave (4) Correction Toward 158.000 Channel Floor
### 🇺🇸🇯🇵 U.S. Dollar / Japanese Yen ( FX:USDJPY ) Daily Macro Technical Study (Ref: USDJPY_2026-07-09_08-44-48.png)
We are deploying a comprehensive structural and behavioral forecast for the USDJPY currency pair on the Daily (1D) interval. The asset continues to trend within a pristine, high-timeframe ascending channel framework, adhering strictly to classical Elliott Wave structural impulses.
The pair shows minor intraday distribution signatures today, trading down **-0.18% at 162.346**, signaling a local momentum shift near multi-month structural extremes.
---
### 🔍 Elliott Wave Anatomy & Channel Geometry:
Our active systematic model breaks down the current macro sequence across two major technical dimensions:
1. **Wave (3) Apex & Rejection at the 164.000 Ceiling:** The strong, volume-backed impulse sequence has formally completed its **Wave (3)** extension right at the upper red diagonal boundary of the ascending channel. The localized double-top structure and distinct upper wicks printed near the **163.000 – 164.000** supply block confirm heavy institutional profit-taking.
2. **The Wave (4) Correction Path (Target 158.000):** As modeled by our blue tracking vector, price action is entering a necessary corrective phase. We anticipate a controlled mean-reversion decline targeting the **158.000 psychological baseline**. This zone acts as a massive confluence floor, overlapping the primary **ascending channel support line** and sitting just ahead of the macro institutional **200-period EMA (purple line at 156.975)**.
* *Note:* The rising **72-period SMA ribbon (orange line at 159.701)** will act as the first intermediate dynamic cushion during this distribution.
---
### 🚀 Future Outlook: The Wave (5) Impulse Launch
Once the market successfully completes the Wave (4) mitigation phase inside the **158.000 – 159.000** demand cluster, aggregate order flow is mathematically positioned to trigger the final cyclical impulse—**Wave (5)**. This secondary expansion leg will target a definitive breakout above local peaks, driving price action back toward the premium channel limits above **164.000**.
### 📊 Tactical Framework Summary:
* **Immediate Bias:** Bearish Corrective (Wave 4 Development)
* **Core Downside Target:** 158.000 (Channel Floor & Dynamic Confluence)
* **Macro Swing Bias:** Heavily Bullish (Awaiting Wave 5 Accumulation Signatures)
---
📊 **ChartPro Data**
*FX Structural Architecture, Elliott Wave Sourcing & Trend Geometry Matrices.*
⚠️ **Disclaimer:** For educational and informational purposes only. This market study represents a personal trading framework and does not constitute financial or investment advice. Bitcoin Buyers Stay in Control — Can Bulls Reach 64.8K?Hello traders! Here’s my technical outlook based on the current BTCUSDT (2H) chart structure. BTCUSDT previously traded inside a descending triangle, where repeated rejections from the resistance line confirmed strong selling pressure. After breaking below the 62,500 Buyer Zone, price entered a consolidation range before buyers regained control and launched a strong recovery. Currently, BTCUSDT is trading above the 62,500 Buyer Zone while remaining below the 64,800 Seller Zone. Price has broken above the range and continues to respect a rising support channel, signaling that buyers remain in control in the short term. As long as BTCUSDT holds above the 62,500 Buyer Zone and respects the ascending support line, the bullish scenario remains valid. A continuation higher could push price toward the 64,800 Seller Zone (TP1), where sellers may attempt to regain control. Please share this idea with your friends and click "Boost" 🚀  Long
Long
 Long
Long
Long 
GOLD - Breakdown from consolidation. Bearish pressureFX:XAUUSD failed to extend last week's rally despite the temporary improvement in the fundamental backdrop. Following yesterday's geopolitical escalation, market sentiment has shifted again, putting renewed pressure on the metal
Gold recovered modestly on Wednesday after its recent decline, but gains remain limited by the stronger U.S. dollar. Market attention is now focused on the minutes from the June FOMC meeting, which could provide further clues about the Fed's rate outlook.
Additional pressure comes from renewed tensions between the U.S. and Iran and rising oil prices, both of which have reinforced inflation concerns. As a result, markets have increased the probability of a September Fed rate hike to 63%. Gold's next move will likely depend on both the FOMC minutes and further developments in the Middle East
Resistance levels: 4123, 4133, 4195
Support levels: 4090, 4030, 3960
Technically, after breaking out of its consolidation range, gold is now forming a countertrend correction toward a liquidity zone while producing a false breakout above resistance. Bears are attempting to defend the 4120–4130 resistance area. A consolidation below 4120–4130 could trigger another decline toward 4090, 4030, and 3959, as selling pressure continues to build within both the local and the broader bearish trends
Best regards,
R. Linda  Short
Short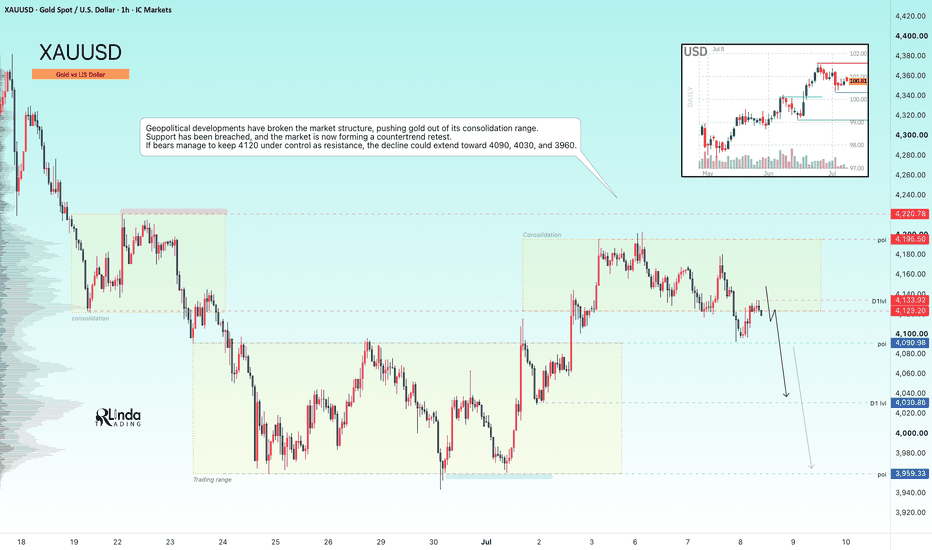
 Short
Short
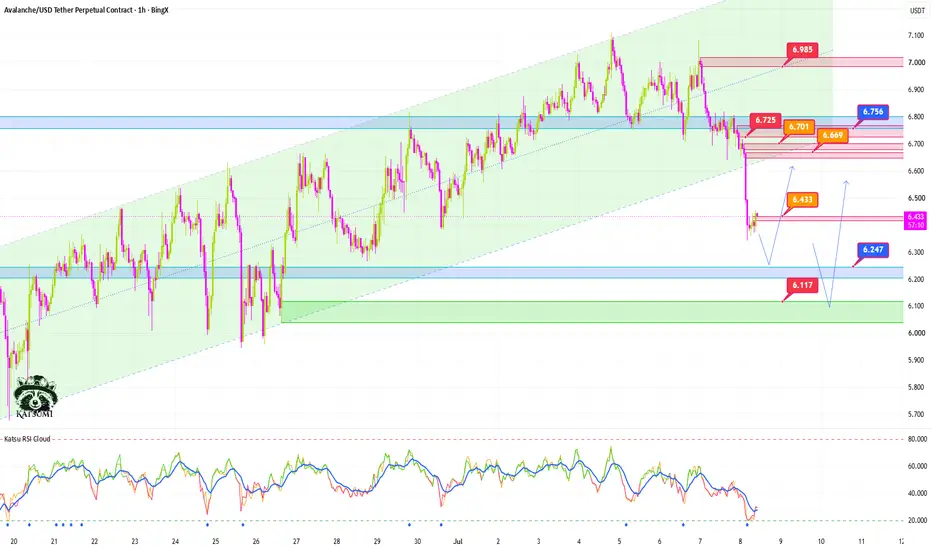
Technical Update: Liquidity Cascade, Key OBs, and FVG TargetsThe price had been moving nicely inside an ascending channel until yesterday, when it broke down from the structure.
The current drop was caught by an older Order Block, but it is clearly visible that the large bearish candle was not random. As price moved lower, long positions were likely stopped out one after another, adding extra sell pressure to the move.
I marked a support zone in blue, which could hold the price if the decline continues. If that level fails, I marked a stronger Order Block in green, where price could potentially react and turn back to the upside.
It is also worth noting that the move left behind an FVG. If price bounces, this imbalance could later be revisited, which may offer a clean trading opportunity.
I also marked the bearish Order Blocks above. The orange zones represent smaller, weaker OBs, while the red zones are stronger resistance areas.
Whenever price reaches these zones, something usually happens: price may reject, consolidate, or break through and accelerate. That is why I marked them. These areas can be traded well if we combine them with additional confirmation, such as candlestick patterns, volume, lower-timeframe RSI, or other signals.
The RSI still looks acceptable, and there is no clear divergence. On the 1H timeframe, RSI is currently in oversold territory, so a short-term bounce or sideways movement would not be surprising before the market cools down and potentially attempts another move lower.
I marked the path I am currently watching on the chart. My main scenario is that price may move slightly lower first, then potentially start turning back to the upside from one of the marked demand zones.
Supports: 6.247 / 6.117
Minor resistances: 6.433 / 6.669 / 6.701
Major resistances: 6.725 / 6.756 / 6.985
Please treat these levels as zones, not exact prices. That is why I draw areas instead of single lines.  Short
Short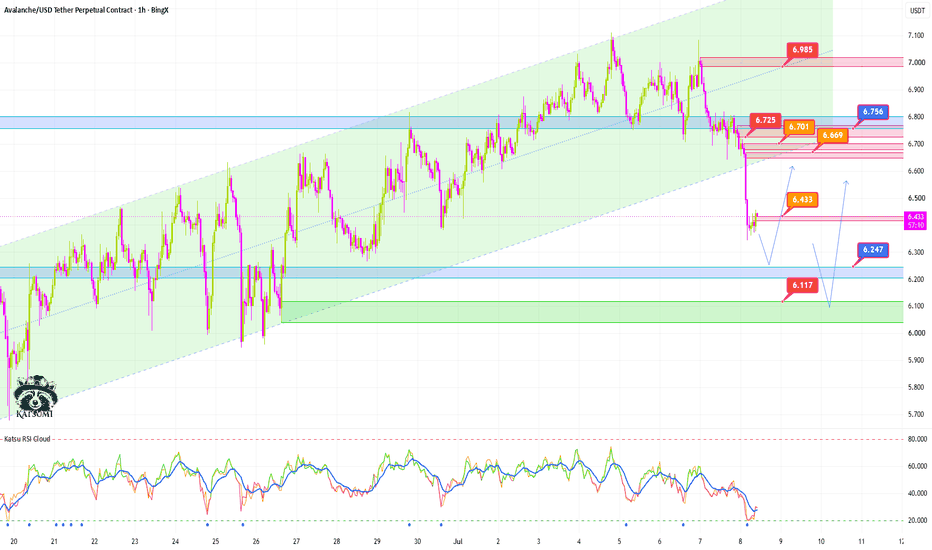
BTCUSDT Short: Reaches Supply Line – Rejection Scenario in FocusHello traders! Here’s my technical outlook based on the current BTCUSDT (4H) chart structure. BTCUSDT previously traded inside a broad descending channel before breaking below support, confirming strong bearish momentum. After finding demand near 61,000, buyers triggered a recovery, but price has now reached a major descending supply line and key resistance area.
Currently, BTCUSDT is trading below the 64,000 Supply Zone while holding above the 61,000 Demand Zone. The recent rally is testing long-term trendline resistance, where sellers may attempt to regain control.
As long as BTCUSDT remains below the 64,000 Supply Zone and respects the descending supply line, the bearish scenario remains valid. A rejection from current levels could push price back toward the 61,000 Demand Zone (TP1). Manage your risk! Short 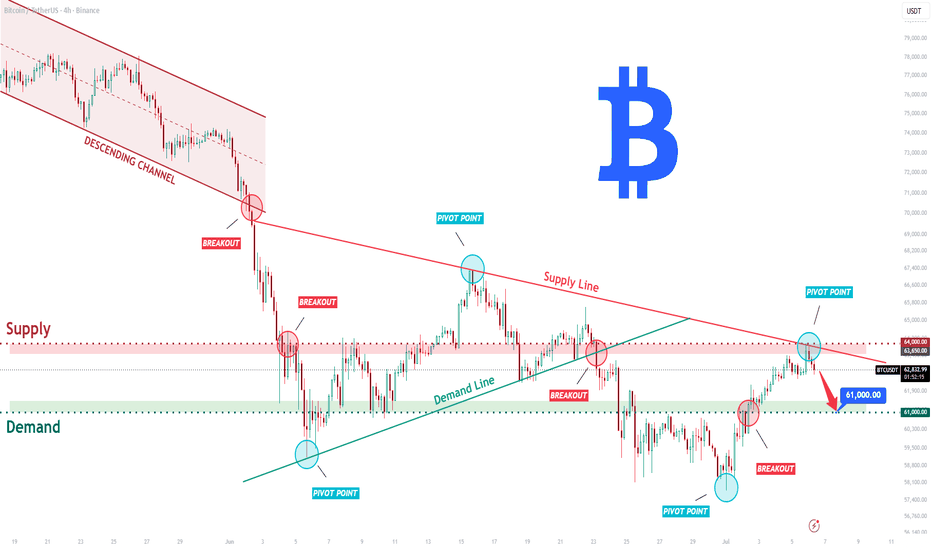
BTCUSDT: Pullback To Support Zone Before Possible Further GrowthHello everyone, here is my breakdown of the current BTCUSDT setup.
Market Analysis
BTCUSDT previously traded inside a descending channel before breaking below a consolidation range, extending the bearish trend. After finding support near the 61,000 Support Zone, buyers stepped in and pushed price above both the channel resistance and the descending trendline, signaling improving short-term momentum.
Currently, BTCUSDT is trading above the 61,000 Support Zone while remaining below the 65,600 Resistance Zone. Price is approaching a key resistance confluence, where sellers may attempt to regain control.
My Scenario & Strategy
As long as BTCUSDT remains below the 65,600 Resistance Zone, the bearish scenario remains valid. A rejection from the descending channel resistance could return the price to the 61,000 support zone (TP1), where buyers could attempt to stabilize the market.
However, if BTCUSDT breaks above the 65,600 Resistance Zone and confirms a sustained move higher, the bearish outlook would weaken and a stronger bullish continuation could develop.
That’s the setup I’m tracking. Thank you for your attention, and always manage your risk. Short 
HYPEUSDT - Consolidation Before Further Growth BINANCE:HYPEUSDT.P is consolidating within both its local and global bullish trends. Technically, this phase appears to be a period of accumulation before a potential continuation of the uptrend
Bitcoin is currently caught between three major forces: the Fed's softer rhetoric, a reversal in ETF flows, and renewed geopolitical tensions in the Middle East. While Bitcoin remains in a countertrend correction within its broader bearish trend, HYPE continues to show relative strength. The market is forming two key trigger levels around the boundaries of the current trading range: 72.09 and 68.30
Resistance levels: 72.09, 77.00
Support levels: 68.30, 65.60
Technically, two scenarios remain in focus before the next bullish leg. The first is a retest of resistance followed by a breakout, where consolidation and a close above 72.09 could trigger further upside. Alternatively, the market may first perform a long squeeze below the 68.30 support level before resuming its upward trend
Best regards,
R. Linda  Long
Long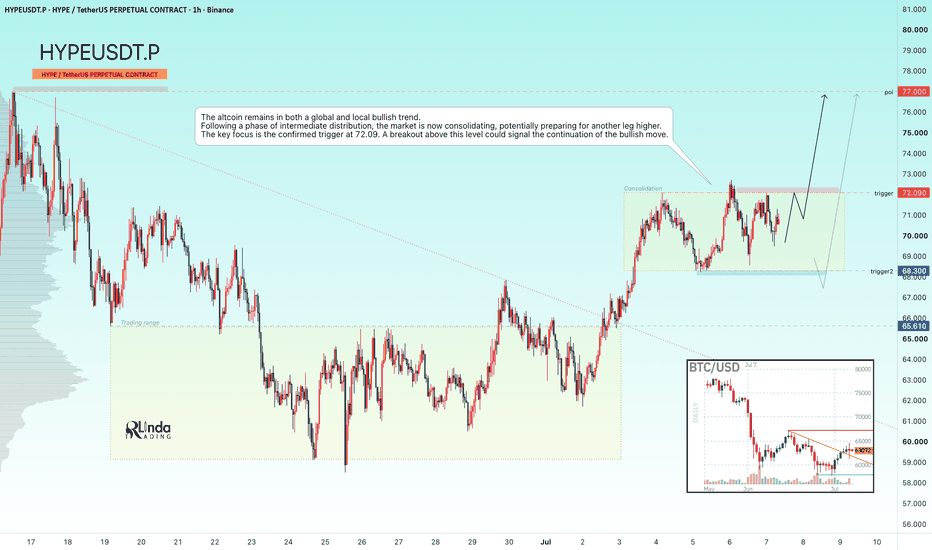
 Long
Long
GOLD - A pullback before a potential rise to 4220 Following the breakout above the 4100 consolidation range and the recent rally, ICMARKETS:XAUUSD has entered a corrective phase. The geopolitical and fundamental backdrop remains unstable
Gold staged a strong recovery after weaker-than-expected U.S. employment data shifted Fed expectations from hawkish to more neutral. The probability of a September rate hike has fallen from 66% to around 53–55%, while the U.S. dollar has stalled and Treasury yields have declined, creating favorable conditions for a rebound after gold's sharpest quarterly drop in years.
However, with the start of the new trading week, gold has temporarily lost momentum due to renewed geopolitical developments. Market attention is now focused on headlines from the Middle East and the return of liquidity following the U.S. holiday weekend.
Key drivers:
Bearish for gold: stronger U.S. dollar, renewed geopolitical risks, profit-taking after the recent rally.
Bullish for gold: weaker U.S. dollar, progress in geopolitical negotiations, and the return of market liquidity after the U.S. holidays
Resistance levels: 4198, 4220
Support levels: 4144, 4121, 4095
Technically, market makers may target a retest of the 4198–4220 liquidity zone and the recent swing high. However, both the Asian and European sessions are currently favoring a corrective move and a liquidity hunt before another potential rally. A long squeeze into the 4144–4121 support zone could trigger another bullish impulse.
However, keep in mind that both the local and the broader market trends remain bearish.
Best regards,
R. Linda Long 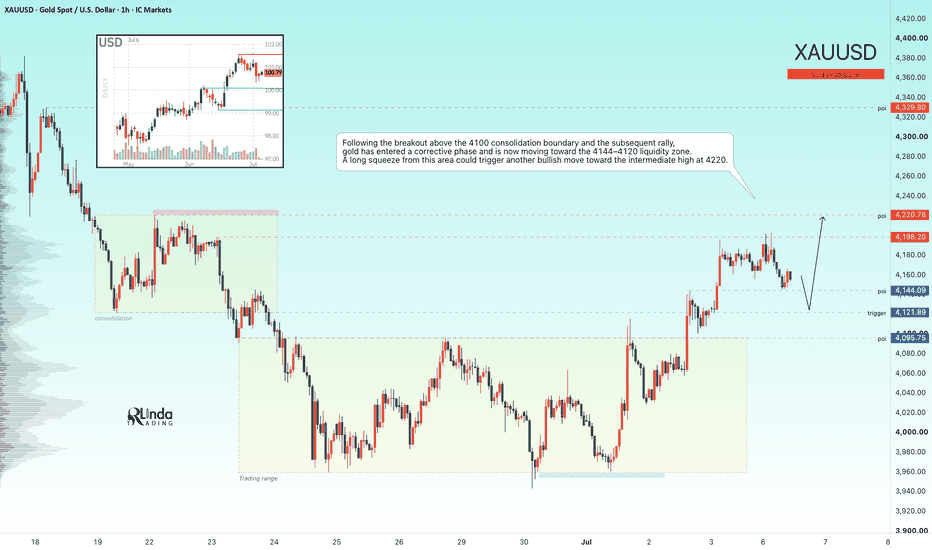
 Short
Short
Short 
EURUSD: Reclaims Support, Setting Up for a Bullish ContinuationHello everyone, here is my breakdown of the current EURUSD setup.
Market Analysis
EURUSD previously traded inside a broad descending channel, where sellers maintained control throughout the downtrend. After a prolonged consolidation inside a large range, price broke below the range support and continued its bearish move. Later, another breakdown below the 1.1480 Resistance Zone accelerated the decline toward the 1.1370 Support Zone, where buyers finally stepped in.
Currently, EURUSD is trading above the 1.1370 Support Zone while remaining below the 1.1480 Resistance Zone. Price has established a rising support trendline after bouncing from the lows, suggesting that buyers are attempting a short-term recovery.
My Scenario & Strategy
As long as EURUSD remains above the 1.1370 Support Zone and continues to respect the ascending support line, the bullish recovery scenario remains valid. A continuation higher could push price toward the 1.1480 Resistance Zone (TP1).
However, if EURUSD breaks below the support zone and loses the ascending trendline, the recovery outlook would weaken and sellers could regain control.
That’s the setup I’m tracking. Thank you for your attention, and always manage your risk. Short