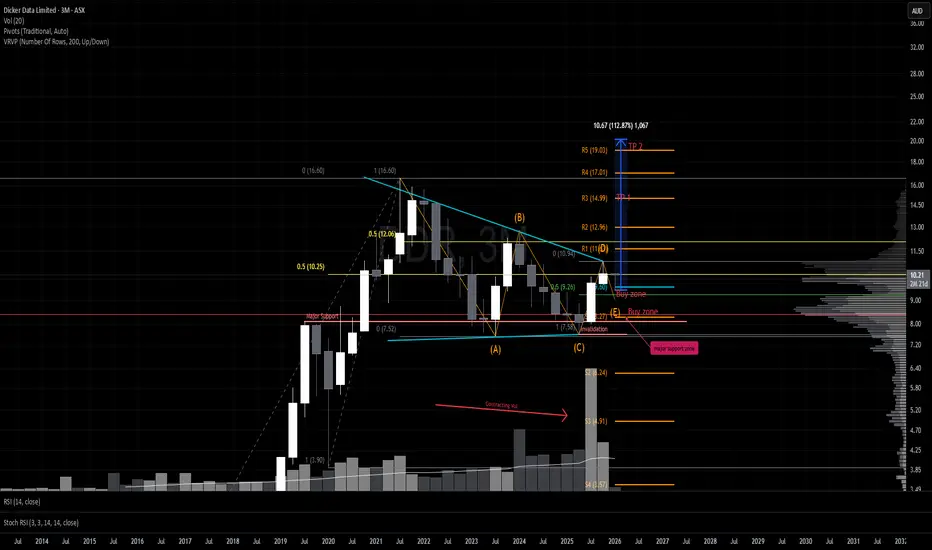
Monthly Structure Tightening — Wave 5 LoadingDDT is forming a clean Elliott Wave contracting triangle as a Wave 4 consolidation. As long as Wave E pulls back without breaking the Wave C low, the structure remains valid and a continuation breakout becomes the higher‑probability path.
The simple triangle thrust target is marked on the chart, while the broader range target will depend on where Wave E completes.
Key areas of interest for a potential Wave E low include:
A rally from current levels that sees the January candle break and close above the Wave D high, signalling early strength and a possible premature completion of Wave E.
A continued pullback toward the ~$8.46 region, ideally accompanied by declining volume and narrowing candle spreads, which would align with classic Wave E behaviour inside a contracting triangle.
If the structure holds, the next move should be the Wave 5 breakout.
Pivot Points
$BTC - Short Setupgm! Been AFK for a couple days and really missed that beautiful move. Well played to all my friends who
Here’s the setup I’m watching atm. I’ll be looking to short if we see signs of weakness here — either another push into 81.7–82k to fill roughly half the wick, or a stop run into 82.7–83k
Stoploss and targets on the chart. Happy Fri-yay!
XAUUSD: 4481 Key Level — Bullish or Bearish BreakoutGold is trading around an important decision area near 4481. I’m watching this level for confirmation before choosing direction.
Bullish scenario:
If price stays above 4481 and confirms the breakout, I will look for continuation higher.
Targets: 4491 → 4501 → 4512
A strong move above these levels could open the way for further upside.
Bearish scenario:
If price falls below 4481 and fails to recover it, I will look for downside continuation.
First important support: 4469
Below 4469, the next lower levels become the focus.
The plan is simple:
Above 4481 = bullish bias
Below 4481 = bearish bias
I will wait for a clear candle close and retest before entering, rather than trading the first break.
This is my personal market view and not financial advice.
EURGBP: Bullish Push to 0.86500?FX:EURGBP is eyeing a bullish continuation on the 4-hour chart after a clear breakout and momentum move above previous resistance, with price pulling back toward a key support zone near the upward trendline, converging with a potential entry area that could ignite further upside momentum toward the higher resistance zone if buyers defend amid volatility. This setup suggests a solid rally opportunity with more than 1:3.5 risk-reward .🔥
Entry between 0.85850–0.85780 (entry from current price with proper risk management is recommended). Target at 0.86500 . Set a stop loss at a daily close below 0.85670 , yielding a risk-reward ratio of more than 1:3.5 . Monitor for confirmation via a bullish candle close above entry with rising volume.🌟
Fundamentally , EURGBP is trading around 0.8588 in early September 2026.
For the Euro, one of the most important releases this week (2–4 September) is the Eurozone Services PMI Final (August) on Thursday, September 3, which will provide key insight into the services sector activity.
For the British Pound, high-impact data is relatively limited in the remaining days of the week, with markets mainly monitoring secondary releases and broader risk sentiment. 💡
📝 Trade Setup
🎯 Entry (Long):
0.85850 – 0.85780
(Entry from current price is acceptable with proper position sizing and strict risk management.)
🎯 Target:
0.86500
❌ Stop Loss:
Daily close below 0.85670
📈 Risk-to-Reward:
More than 1:3.5
Will buyers defend 0.85850–0.85780 and push EURGBP toward 0.86500, or will the support fail and invalidate the bullish setup? 👇
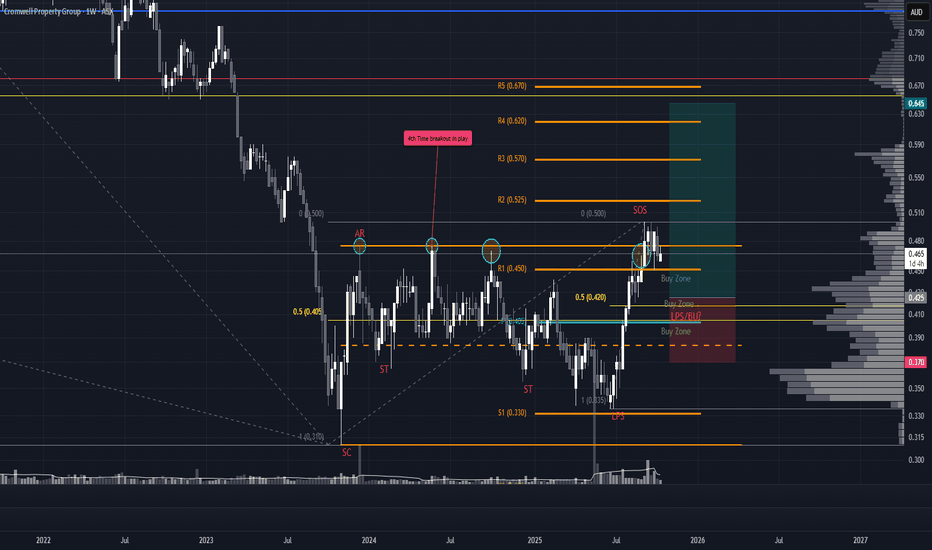
Structure Holds as LPS Reload LoomsCMW is shaping up well with a clean structural setup. Price action suggests we may be in the process of forming another Last Point of Support or Backup.
Trade Scenario
If price continues to pull back, monitor the highlighted zones for a potential entry. Since we do not yet have a confirmed higher low, the initial stop loss should be placed at the $0.330 low.
Risk management is critical here—avoid overexposure until structure confirms. If a higher low forms as outlined on the chart, the stop can be adjusted to that level.
That said, we are also working with a Gann fourth time breakout. This means price may not pull back immediately. If it breaks above the local high at $0.50, traders can look to the daily timeframe for a clean continuation setup toward the $0.57 zone.
As always, keep it simple and let structure lead. Risk management is the foundation—protect capital first, then let the trade work.
Rebalance After Expansion and a Potential Long Reaction
EUR/USD showed a strong upside expansion with almost no proper rebalance around the 0.5 area. After a reversal structure formed, price delivered sharply lower and returned into this range, rebalancing most of the previous move.
At the current stage, I expect an additional liquidity manipulation and a move into the 0.786 / EMA Shelf area.
After a reaction from this zone, I will be looking for an upside rebalance. The main profit-taking level and idea invalidation are marked directly on the chart.
Scenario: Liquidity Sweep → 0.786 / EMA Shelf → Reaction → Rebalance ↑
GOLD (XAUUSD) – FULL DAY ROADMAP | SEPT 3, 2026Bias: 📉 Bearish (fade rallies, target 4,361)
Timeframe: 15m – 1H
📊 THE SETUP
Gold is at 4,388. The market is range-bound with a downward pull toward 4,361. Price is above that level, so gravity is down.
Expected range today: 4,338 – 4,428 (±45 pts)
Price is choppy between two Reinforced levels 4394 and 4383 Now
🛠️ TODAY'S PLAYS
Trade 1 (Best Setup)
Sell at 4,415
Target: 4,383 → 4,361
Stop: Above 4,420
Trade 2 (If We Drop)
Buy at 4,350 (only if it holds)
Target: 4,383
Stop: Below 4,345
Trade 3 (Breakdown)
Sell if price breaks below 4,361
Target: 4,350 → 4,328
Stop: Above 4,370
Trade 4 (Breakout)
Buy if price breaks above 4,415
Target: 4,427 → 4,448
Stop: Below 4,404
🚨 WHAT INVALIDATES THIS
If This Happens Do This
Close above 4,420 Cover shorts – breakout is real
Close below 4,345 Cover longs – breakdown is real
Volume doubles Follow the direction of the volume
⚠️ DISCLAIMER
This is not a financial advice. Trading is risky. Use stops and proper size. This is just a roadmap based on dealer positioning and market structure.
Good luck today. Trade the edges, not the magnet.
$GRAM: Market analysis. Long entryBYBIT:GRAMUSDT.P
Price hit monthly support 📊M-Levels: $1.293 - $1.364
As 🧩IMA shows, 🐋major players load longs on every dip. Spot market also catches capital inflow. Points to steady whale interest in the asset
🟡 Trade plan:
Enter on reversal confirmation
🟢 1st entry: $1.352 (near 📊D-Levels support)
🟢 2nd entry: $1.298 (near 📊D-Levels support)
🛑 Stop-loss: $1.191
Liked the analysis? Drop a 🚀!
🧩IMA — Integrated Market Analysis
📊M-Levels — Institutional Interest Levels
⚠️ Platform limits block closed indicators. Only showing 📊Levels algo results
GBP Buy/Long Serup (15M)After a bearish trend, price has reached a relatively strong support level. Considering the strong bullish CHoCH that has formed and the previous wave high being swept, we can look for a buy setup.
We have two entry points, and we will enter using a DCA strategy.
Targets are marked on the chart. Move your stop loss to break-even at the first target.
A daily candle close below the invalidation level will invalidate this analysis.
If you have a coin or altcoin you want analyzed, first hit the like button and then comment its name so I can review it for you.
Do you think GBPUSD is bullish?
NZDUSD: Bullish Push to 0.619?FX:NZDUSD is eyeing a bullish continuation on the 4-hour chart , with price approaching a key support zone near the upward trendline after recent pullback, converging with a potential entry area that could ignite further upside momentum toward the higher resistance zone at the 0.786 Fibonacci level if buyers defend amid volatility. This setup suggests a solid rally opportunity with more than 1:4.5 risk-reward .🔥
Entry between 0.588–0.590 (entry from current price with proper risk management is recommended). Target at 0.619 . Set a stop loss at a daily close below 0.585 . Monitor for confirmation via a bullish candle close above entry with rising volume, leveraging the pair’s strength near support.🌟
Fundamentally , NZDUSD is trading around 0.594 in late August 2026.
For the US Dollar, the most important release this week (26–28 August) is the US Core PCE Price Index (July) on Wednesday, August 26 — the Federal Reserve’s preferred inflation gauge that can significantly influence dollar strength.
For the New Zealand Dollar, key domestic data includes Labour market statistics (income) and Employment indicators, which will provide important insights into the health of the NZ economy. 💡
📝 Trade Setup
🎯 Entry (Long):
0.588 - 0.590
(Entry from current price is acceptable with proper position sizing and strict risk management.)
🎯 Target:
0.619
❌ Stop Loss:
Daily candle close below 0.585
📈 Risk-to-Reward:
More than 1:4.5
💡 Will buyers defend the 0.588 - 0.590 support zone and push NZDUSD toward 0.619, or will stronger US inflation data derail the bullish structure? 👇
ELON Main Trend. Channel. Wedge. 09 2026Logarithm. 1-week time frame for clarity, zones for potential local and medium-term work. It is also quite possible (not guaranteed), in the overall market distribution zone, to reach the specified maximum target zones.
🟣 Local pattern Dragon (implemented and confirmed after a breakout of the wedge resistance). After the breakout, it is possible (because this is a memecoin and can reverse at any moment) that the price will fluctuate within the horizontal channel range or form a large bowl within this volatility range. I recommend working primarily with local targets on such assets, and leaving a small portion of the market for higher targets, if desired.
GOLD (XAUUSD) – FULL DAY ROADMAP SEPT 03Bias: 📉 Bearish (fade rallies, target 4,361)
Timeframe: 15m – 1H
📊 THE SETUP
Gold is at 4,383. The market is range-bound with a downward pull toward 4,361. Price is above that level, so gravity is down.
Expected range today: 4,338 – 4,428 (±45 pts)
🛠️ TODAY'S PLAYS
Trade 1 (Best Setup)
Sell at 4,415
Target: 4,383 → 4,361
Stop: Above 4,420
Trade 2 (If We Drop)
Buy at 4,350 (only if it holds)
Target: 4,383
Stop: Below 4,345
Trade 3 (Breakdown)
Sell if price breaks below 4,361
Target: 4,350 → 4,328
Stop: Above 4,370
Trade 4 (Breakout)
Buy if price breaks above 4,415
Target: 4,427 → 4,448
Stop: Below 4,404
🚨 WHAT INVALIDATES THIS
If This Happens Do This
Close above 4,420 Cover shorts – breakout is real
Close below 4,345 Cover longs – breakdown is real
Volume doubles Follow the direction of the volume
⚠️ DISCLAIMER
This is not financial advice. Trading is risky. Use stops and proper size. This is just a roadmap based on dealer positioning and market structure.
Good luck today. Trade the edges, not the magnet.
BTCUSD: 81.4K Liquidity Sweep + Fresh 4H SELL SignalBTC has swept buy-side liquidity above the previous $81,255 high, reaching approximately $81,455, but buyers were unable to hold the breakout.
The rejection was followed by strong bearish displacement and expanding volume. My Swing Signals & Structure indicator then generated a fresh 4H FAST SELL signal at $77,557 on August 28.
At the time of this update, BTC is trading around $78.2K, so this remains an OPEN setup rather than a completed move.
My primary expectation is a short-term bearish correction.
The first important area is $77.6K–$76.9K. BTC has already reacted around this liquidity zone, but a confirmed 4H break below $76.9K would increase the probability of continuation toward:
$75.6K — structural support
$73.2K — T1
$63.8K — extended T2 if the higher-timeframe structure also breaks
The important resistance area is around $79.5K–$80K.
The bearish setup remains valid while BTC stays below $81,623. A break above that level would invalidate the current 4H SELL structure.
One important point: the 6H structure is still stronger than the 4H. The previous 6H QUALITY BUY appeared around $64,280 and captured the major rally toward $81K.
Because of that, I currently see this as a 4H bearish correction rather than confirmation of a major Bitcoin top.
Bias: BEARISH / CORRECTION
Timeframe: 4H
Invalidation: $81,623
Primary Target: $73,209
#BTC #Bitcoin #BTCUSD #MarketStructure #PriceAction
Buy Setup On SILVER (XAGUSD)! Don't Miss IT! (15M)After a round of correction, strong buyers have entered the market and created a bullish move, forming a bullish CHoCH.
We are looking for scalping long positions around the supportive order blocks. The green zone is the most optimal and preferred entry area.
Targets are marked on the chart. Once a 1:1 risk-to-reward is reached, move your stop loss to break-even and secure some profit.
If the stop loss is hit, we will exit this position.
If you have a coin or altcoin you want analyzed, first hit the like button and then comment its name so I can review it for you.
Do you think XAGUSD is bullish?
$MSTR back to sub $100Everyone got overly excited in the crypto space and that includes MSTR. However, the MSTR chart doesn't look great.
If we look at the overall trend, you can see that we've been in a downtrend ever since we broke the flag to the downside.
The recent bounce just took us back to the $130 range where we formed a double top. If price can't make it back above $137, then the most likely path is down.
I think we see one final capitulation even that brings MSTR down to the lower support levels with the final low being somewhere in the $20-40 range.
$ZEC: Where's the breakout? Chart breakdown 2/08BYBIT:ZECUSDT.P
An interesting setup formed on the chart. After a strong rally and making a new all-time high, price built a consolidation zone between the monthly support and resistance M-Levels.
Right now, price tested the monthly support level again, and we saw a reaction from buyers right at this level.
🧩IMA data shows that 🐋large players are in a neutral position, no clear lean to either side. Here we're dealing with two factors that could dictate the price direction: the interest in privacy coins and the structural market analysis.
Given the setup, there are two possible scenarios:
1 scenario: A breakdown of the $750 support opens the path to the historical support level at $610–$650. This is the most likely option after an all-time high update.
2 scenario: A breakout above resistance, then we can expect price to push up to the $971 level.
⚠️If the idea was useful — glad to have your support 🚀.
🧩IMA — Integrated Market Analysis
📊M-Levels — Institutional Interest Levels
Platform restrictions don't allow publishing closed indicators. I only display the result of the 📊Levels algorithm.
EURUSD: Bullish Push to 1.1796?FX:EURUSD is eyeing a bullish continuation on the 4-hour chart , with price approaching a key support zone near the upward trendline after recent consolidation, converging with a potential entry area that could ignite further upside momentum toward the higher resistance zone if buyers defend amid volatility. This setup suggests a solid rally opportunity with more than 1:3.5 risk-reward .🔥
Entry between 1.1585–1.1614 (entry from current price with proper risk management is recommended). Target at 1.1796 . Set a stop loss at a daily close below 1.156 , yielding a risk-reward ratio of more than 1:3.5 . Monitor for confirmation via a bullish candle close above entry with rising volume, leveraging the pair’s strength near support.🌟
Fundamentally , EURUSD is trading around 1.166 in late August 2026.
For the Euro, one of the most important releases this week (25–28 August) is the ECB Monetary Policy Meeting Accounts on Thursday, August 27, which will provide key insights into the ECB’s policy outlook.
For the US Dollar, the standout event is the US Core PCE Price Index (July) on Wednesday, August 26 — the Federal Reserve’s preferred inflation gauge that can significantly influence dollar direction. 💡
📝 Trade Setup
🎯 Entry (Long):
1.1585 – 1.1614
(Entry from current price is acceptable with proper position sizing and strict risk management.)
🎯 Target:
1.1796
❌ Stop Loss:
Daily candle close below 1.1560
📈 Risk-to-Reward:
More than 1:3.5
💡 Will buyers defend the 1.1585–1.1614 support zone and push EURUSD toward 1.1796, or will stronger US inflation data derail the bullish structure? 👇
CHF/USD: A Setup for The Leap Participants
For those taking part in The Leap, here is my current view on CHF/USD.
Price continues to move lower after a series of rebalances and is now trading near the lower part of the current range. I expect a local reaction/pullback first, while the main scenario remains a continuation lower toward the 1.414 external expansion and the lower POI.
The key structure and confirmation area are marked on the chart.
Scenario: Local Rebalance → Reaction → Bearish Continuation → 1.414 POI
Key Imbalances and Breaker Block ConfirmationSOL/USDT · 30M
The asset has formed several key imbalances. I am now waiting for confirmation of the Breaker Block and a test of the marked range before further downside continuation.
If the reaction is confirmed, the main scenario is bearish delivery toward 1.0 first, followed by the 1.414 external expansion.
Profit-taking levels and idea invalidation are marked directly on the chart.
Scenario: Key Imbalance → Breaker Block → Confirmation → 1.0 → 1.414.