WTI Crude Oil: Bearish Rejection — Drop to $87.38?Hook :
As the previous analysis worked exactly as predicted, CFI:WTI is recovering into a descending trendline and a key supply zone — but the rebound is approaching an area where sellers could regain control. If the 94.93–96.38 resistance zone holds, the next major downside target is 87.38. ⚠️
Market Context :
WTI crude oil remains within a broader bearish structure on the 4H chart, with the descending trendline continuing to cap price.
After falling from above $100, price established lo
Pivot Points
GBPAUD: Bullish Continuation 🇬🇧🇦🇺
GBPAUD went up exactly as I predicted this morning.
It looks like the pair will try to at least partially fill a huge gap down opening.
Expect a bullish continuation to 1.9175 level.
❤️Please, support my work with like, thank you!❤️
I am part of Trade Nation's Influencer program and receive a monthly fee for using their TradingView charts in my analysis.
XAUUSD POTENTIAL BULLISH REVERSALXAUUSD | Potential Bullish Reaction From Demand
Gold remains under bearish pressure on the 1H timeframe, with price forming lower highs and lower lows.
My primary scenario anticipates a continuation toward the 4084–4094 demand zone, where buyers previously demonstrated strong participation.
A successful defense of this area, supported by bullish price action and a shift in lower-timeframe structure, could trigger a recovery toward 4140.
Key levels:
- Demand: 4084–4094
- Bullish target: 4140
AUD: Bearish Setup Ahead (15M)# AUD Short Setup – Bearish Structure and Downside Targets
Price has already formed a bearish CHoCH, indicating a potential shift in market structure toward the downside. Following this structural change, price has now reached a strong origin zone and order block, which could act as a significant area of resistance.
As long as this zone holds, we expect price to react to the downside and potentially continue its bearish movement toward the targets marked on the chart.
Additionally, there is a
Gold Morning Map, Tue 20 Oct: S1 4135 is the battle pointMORNING MAP · Tuesday 20 October
R3 4210
R2 4189
R1 4176
Pivot 4156
S1 4135
S2 4123
S3 4102
The night so far
Gold slipped through S1 in Asia and wicked to 4116, $7 through S2, but the H1 closed back above S2. Buyers took price back above S1 to 4147, just above the 4143–4146 minor resistance flagged last night. Sellers re-entered and took price back to S2. Buyers held S2 for the second time and took price back to S1.
Where price sits
Gold is at 4128, just under S1. Bias: Lower, below the pivot
$BTC - Long SetupWe really need a clean break above 83.1k–83.6k. Overhead supply is pretty saturated, so expecting chop city this week.
Didn’t share this short setup given how slow PA has been, but if we get this long, I’ll look to take it back up into that juicy imbalance at 84.8k–85.5k.
Long entry: 79.9k–79.4k. if we get the lower fill at 79.4k, we’ll adjust the stop lower to 77.5k.
Bitcoin Has Developed a Fully Bearish Structure (4H)As you can see, after forming a Swing High (SWH), Bitcoin developed a bearish Change of Character (CHoCH), signaling a potential shift in market structure toward the downside.
Since then, BTC has consistently formed lower highs and lower lows, indicating that sellers are maintaining control and that the bearish structure remains intact. As long as this pattern continues, the possibility of further downside remains on the table.
Another important factor supporting this bearish outlook is the ma
USD/CHF | Bullish Outlook— Tracking the Next ObjectiveThe bullish outlook remains intact following top-down confirmation of the trend. Last week presented a buy opportunity, and now the focus shifts to the next objective.
Price is currently interacting with the green accumulation/auction zone, where I'm monitoring the reaction. So far, bullish price action is showing up, while long-term momentum remains intact and supportive of the bullish narrative.
My next step is to wait for minor internal liquidity to be taken, followed by a clear bullish rea
EUR/USD | Bearish Bias, Conflicting Footprints
EUR/USD remains on my radar, but I'm seeing something worth watching closely.
Over the years, I've noticed that EUR/USD and GBP/USD often move in similar directions. However, GBP/USD is currently printing bullish structure while EUR/USD is developing a different structural picture. That contrast has my attention.
On EUR/USD, price has mitigated the mid-term auction zone (orange), followed by a lower-timeframe trend shift around the lower green zone, where the previous higher low was breached.
EUR/GBP | Tracking the Sequence — Waiting for ConfirmationPrice has completed a distribution phase following manipulation, building on the expansion that developed out of the previous accumulation.
From there, price reclaimed the higher-timeframe order block (blue zone), followed by a mid-term structural shift at the orange level, breaking the previous lower high.
Price then pulled back, swept the internal leg and inducement to confirm the high, and mitigated the refined mid-term order block — the thin orange zone price is currently hovering around.
CAD/JPY | Bullish Outlook — Tracking Its FootprintsStill holding this trade from previous weeks as price continues delivering in line with the bullish thesis.
Once price broke above the long-term moving average to the bullish side, we began seeing the delivery develop. Structure can establish the narrative, but momentum helps determine whether price has the backing to follow through.
Through top-down confirmation and mitigation, the bullish trend became increasingly aligned. The green levels represent lower-timeframe areas reacting within the
GBP/JPY | Bullish Outlook — Tracking Its FootprintsThe higher-timeframe outlook remains bullish. Price has mitigated the higher-timeframe zone marked in blue, far to the left, and has since been developing intermediate price action within the current mid-term range.
We're beginning to see bullish footprints forming toward the mid-term lower high, with momentum supporting the potential for further upside.
However, I'm not placing any buy points until the mid-term trend shift is confirmed. Potential continuation is one thing; confirmed structure
AUD/JPY | Bullish Outlook — Tracking Its FootprintsThe higher-timeframe outlook remains bullish. Within the blue zone, price delivered a mid-term trend change, breaking the institutional lower high and establishing a new high.
Following that shift, I waited for mid-term mitigation, then lower-timeframe bullish alignment. Price broke the minor lower high, and I began tracking the internal inducement sweep needed to confirm the high. Following mitigation and a bullish reaction, the trend alignment was established, and price delivered significant
USD/JPY | Higher-Timeframe Outlook — Tracking Its Footprints
Price remains bullish from a higher-timeframe perspective, and I’m still holding strong from last week, currently holding four positions and approaching five as I’ve added progressively while price develops in my favor.
As Jesse Livermore’s trading philosophy reminds us, the real money is often made by sitting tight and letting the market do its work. The challenge is staying convicted through the noise.
Price continues climbing toward the mid-term highs, printing higher lows along the way wh
GBP/USD | Weekly Outlook — Tracking Its FootprintsEarly-week update. The higher-timeframe perspective remains bullish, and the objective hasn’t changed from last week or the weeks prior.
Price has shown its hand through price action, breaking above a mid-term structural level — the previous lower high — and punching in a new high.
Now, I’m waiting for that high to be confirmed by taking out the near-term inducement sitting within the internal leg. Once that internal leg is taken and the essential liquidity is cleared, I’ll be looking for pric
Gold: Rejection at R1, Then Break and Retest at the PivotThis morning's daily Fibonacci pivots on XAUUSD were published before these moves. Here's how two of them played out, and how a scalper and a day trader would manage the same moves differently.
Levels (from Friday's high, low and close):
R3 4222 · R2 4203 · R1 4190 · Pivot 4171 · S1 4151 · S2 4138 · S3 4119
The day opened above the pivot, so the bias was higher, with R1 as the level that mattered. The map had both paths. When R1 rejected, the reject path was the one in play.
Setup 1: Rejectio
XAUUSD(Gold):Liquidity Sweep & Yield Reset Tease Massive $4,500Market Overview
Gold (XAUUSD) is building an incredibly bullish continuation structure on the 4-hour chart. After purging late buyers through a sharp corrective phase, price action has aggressively swept structural sell-side liquidity. It is now positioning itself for a powerful impulsive leg upward.
Technical Breakdown & Core Confluences
• The Liquidity Sweep (Green Zone): The market successfully engineered a drop into the primary demand block at $4,050 - $4,080. This flushed out weak-handed
USDCHF: Pullback From Key Level 🇺🇸🇨🇭
USDCHF looks bullish after the recent test of an important key level.
A breakout of the resistance line of the falling wedge pattern on an houly time frame
provides a strong signal.
Goal - 0.827
❤️Please, support my work with like, thank you!❤️
I am part of Trade Nation's Influencer program and receive a monthly fee for using their TradingView charts in my analysis.
GOLD (XAUUSD): Support & Resistance Analysis for Next Week
Here is my latest structure analysis for Gold.
Resistance 1: 4196 - 4269 area
Resistance 2: 4376 - 4444 area
Resistance 3: 4470 - 4511 area
Support 1: 4066 - 4120 area
Support 2: 3995 - 4027 area
Support 3: 3941 - 3975 area
Consider these structures for pullback/breakout trading.
I expect a bearish movement from Resistance 1.
❤️Please, support my work with like, thank you!❤️
I am part of Trade Nation's Influencer program and receive a monthly fee for using their TradingView charts in my
$BTC: Market breakdown. BTC and altseason. 18.10BYBIT:BTCUSDT.P
Nothing changed in BTC since my last analysis a week ago. Despite negative news on the US financial market, buyers holding their positions at 📊M-Levels $80200–$82000.
🧩IMA analysis shows: despite capital outflow from the ETF sector, 🐋large players holding this level for two weeks now, buying the dips. Points indirectly to extended accumulation by large players.
Conclusion. Given the market structure, end of accumulation and move into growth phase will show as breakout and ho
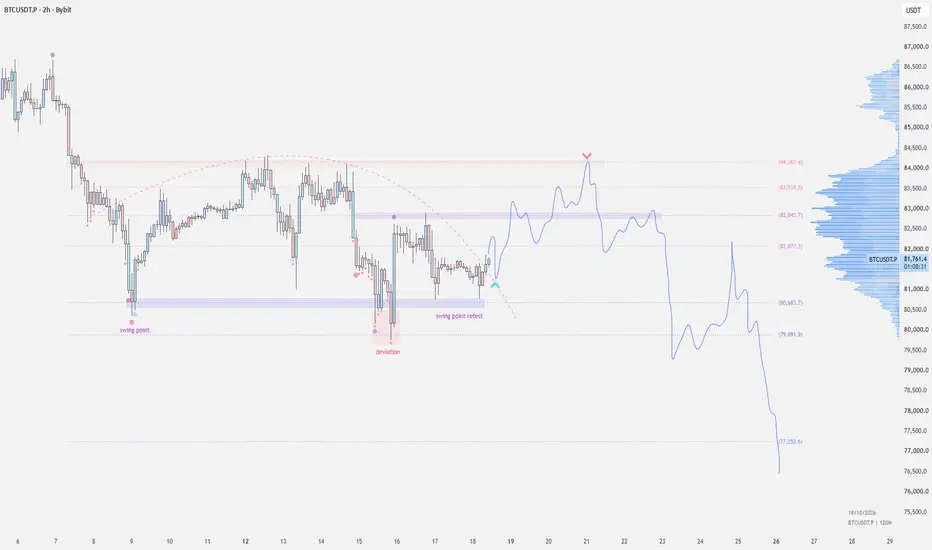
$BTC - Weekend PlanI'm long as price is holding 80.7k after retesting the swing point twice. Hold 81k here, I’m looking for a rotation back into 83.8k–84.6k to test or sweep the marginal highs.
If we just sweep the marginal highs or SFP’d them, I’ll be looking to re-short back into 79ks (market order), or if it could extend lower to 78k–76ks.
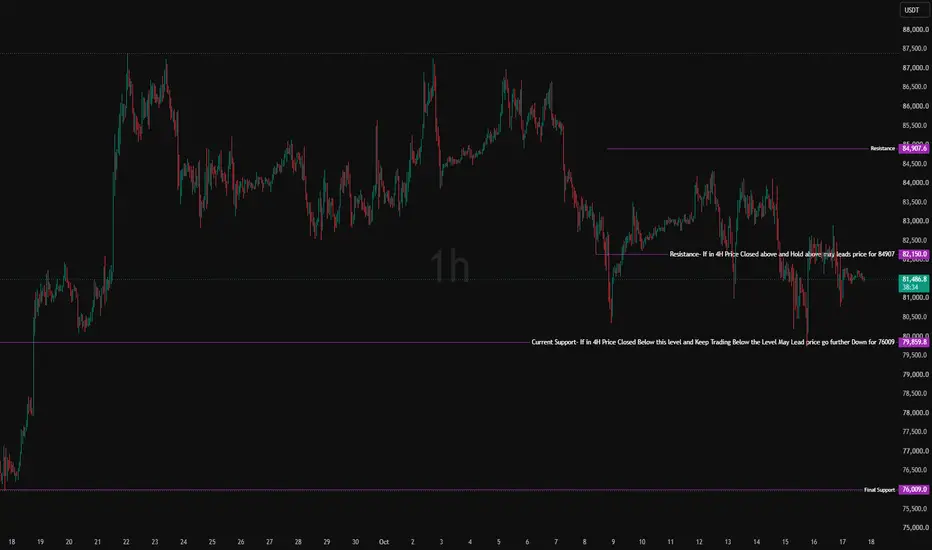
BTC Market StructureBINANCE:BTCUSDT CRYPTO:BTCUSD
BTC is currently trading around 81,454, and the 4H structure is showing weakness following the rejection from the 87K area.
After the strong upside move from the 64K–65K region toward 87K, price failed to sustain those higher levels and started moving lower. Since then, BTC has been forming a corrective structure, with price now trading below the 82,150 resistance level.
For me, the important thing right now is to watch whether BTC continues to trade below this