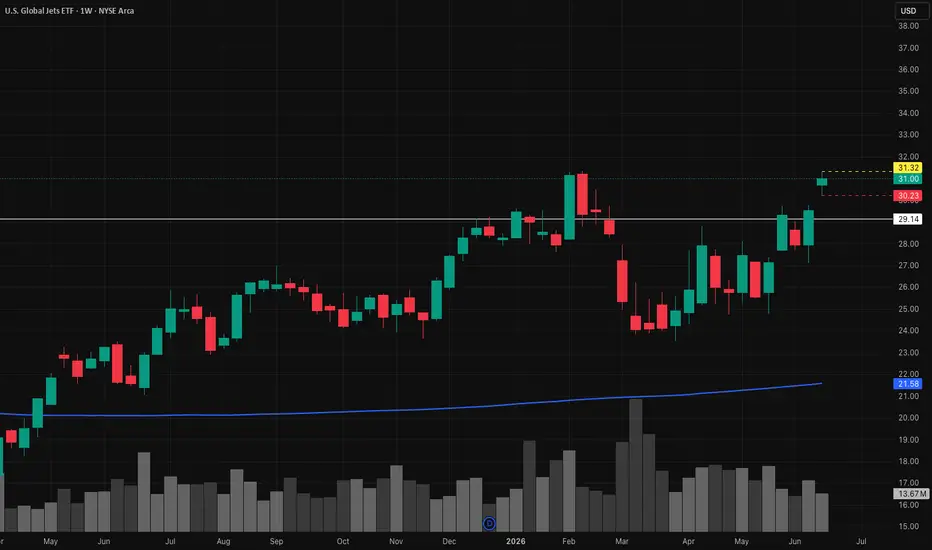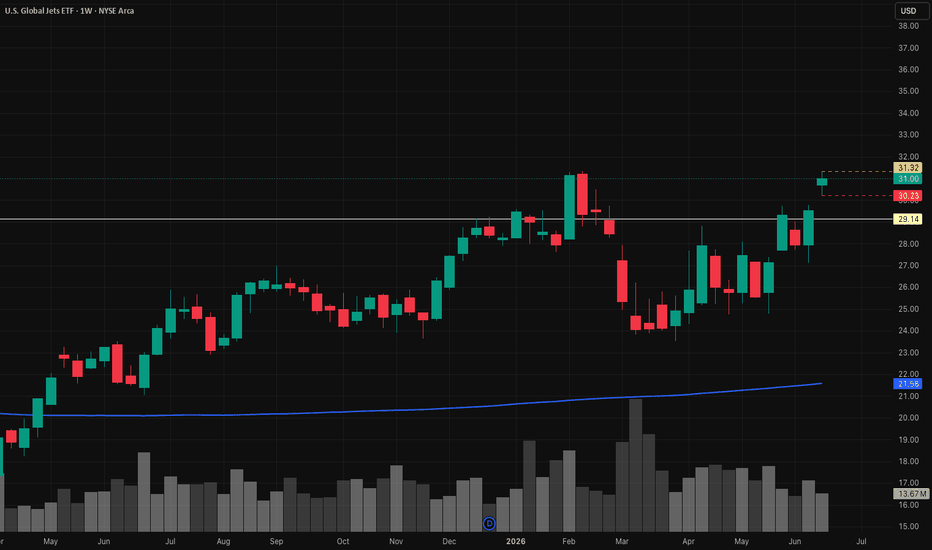
JETS | June, 2026 | Continued growth ETF- Timeframe: Weekly
- Trade type: Buy stop order
- Price: 31.32
- Take Profit: Open
- Stop Loss: 30.23 (-3.50 %)
Idea: Long on a breakout above last week's high — bullish momentum continuation.
Entry: Buy stop above last week’s high.
Stop-loss: Below the low of the same candle.
If the weekly candle closes below this level, the trade is invalidated.
Take Profit: Trailing stop following the lows of new weekly candles.
Pivot Points
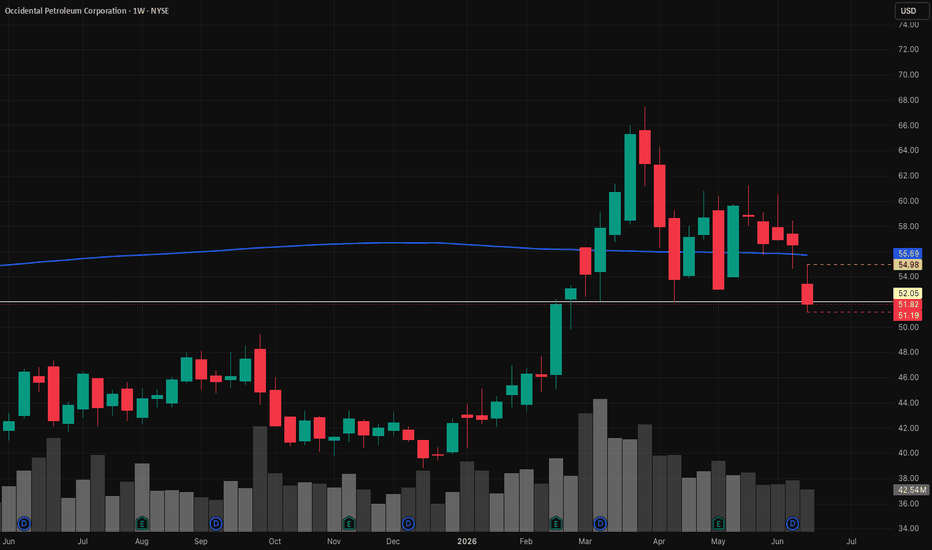
OXY | June, 2026 | Continued stock growth- Timeframe: Weekly
- Trade type: Buy stop order
- Price: 54.98
- Take Profit: Open
- Stop Loss: 51.19 (-6.90 %)
Idea: Long on a breakout above last week's high - bullish momentum continuation.
Entry: Buy stop above last week’s high.
Stop-loss: Below the low of the same candle.
If the weekly candle closes below this level, the trade is invalidated.
Take Profit: Trailing stop following the lows of new weekly candles.
LINE | The time to go long has come- Timeframe: Weekly
- Trade type: Buy stop order
- Price: 45.11
- Take Profit: Open
- Stop Loss: 42.32 (-6.20 %)
Idea: Long on a breakout above last week's high - bullish momentum continuation.
Entry: Buy stop above last week’s high.
Stop-loss: Below the low of the same candle.
If the weekly candle closes below this level, the trade is invalidated.
Take Profit: Trailing stop following the lows of new weekly candles.
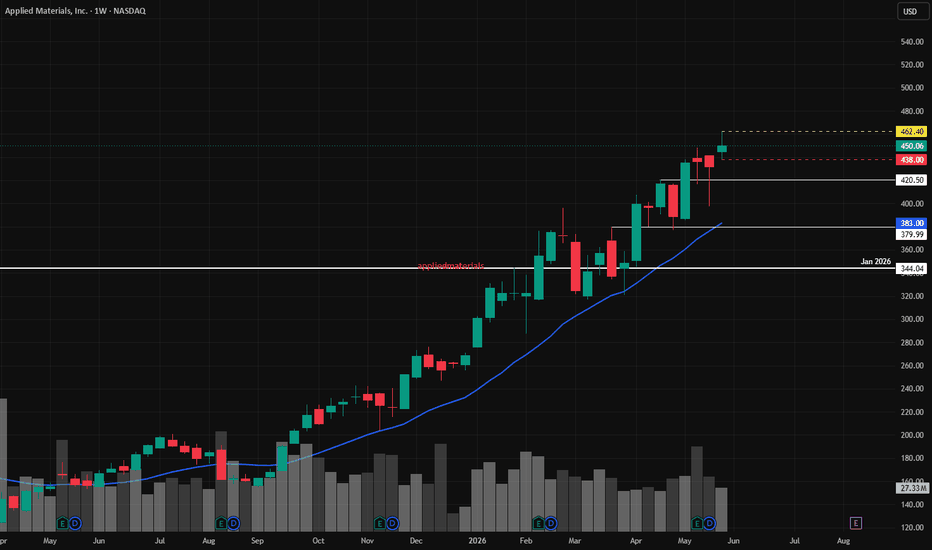
AMAT | May, 2026 | Continued stock growth- Timeframe: Weekly
- Trade type: Buy stop order
- Price: 462.40
- Take Profit: Open
- Stop Loss: 438.00 (-5.30 %)
Idea: Long on a breakout above last week's high — bullish momentum continuation.
Entry: Buy stop above last week’s high.
Stop-loss: Below the low of the same candle.
If the weekly candle closes below this level, the trade is invalidated.
Take Profit: Trailing stop following the lows of new weekly candles.
👉 Pionex | 200+ U.S. stock tokens | xStocks
Feel free to like and share your thoughts in the comments! ❤️
Nifty Analysis EOD – July 7, 2026 – Tuesday🟢 Nifty Analysis EOD – July 7, 2026 – Tuesday 🔴
Gap, Grind, Give Back: Nifty Touches 24,530 Then Fades to 24,398
🗞 Nifty Summary
Nifty gapped up 47 points above the PDH, opening with continuous bullish sentiment. After the first tick, it filled the gap and found a base near PDC, marking the day low almost exactly at that level.
From there, Nifty climbed gradually, breaking above PDH, 24,480, IBH, and 24,500 ~ 24,510, eventually marking the day high at 24,530.70. After hovering above 24,500 for close to an hour, it failed to push any higher. Around 12:10 PM, price came down below the trendline and started falling sharply, losing 111 points from the day high and testing the IBL ~ PDC level.
From that level it tried to build a base and managed a 50-point recovery, reaching VWAP — where selling pressure came in again and pushed Nifty down another 122 points, taking it to the 24,350 support level. The day closed at 24,355.10 without much of a bounce back, though the adjusted close came in at 24,398.70, about 50 points above the day low.
The daily candle closed bearish with wicks on both sides, reflecting a moderate-volatility, somewhat indecisive finish after the intraday swings.
Overall the day gave opportunities on both sides, with high volatility likely tied to expiry-day adjustments. Bullish sentiment might continue tomorrow — today marked the 6th consecutive day forming an HH-HL structure — but the rejection from 24,500 looks like this momentum could be fading. 24,285 ~ 24,235 is the level to watch; a break there might be an early sign to observe in tomorrow’s session.
🛡 5 Min Intraday Chart with Levels
📉 Daily Time Frame Chart with Intraday Levels
🕯 Daily Candle Breakdown
Open: 24,464.45
High: 24,530.90
Low: 24,348.95
Close: 24,398.70
Change: −31.65 (−0.13%)
🏗️ Structure Breakdown
Type: Bearish candle with wicks on both sides — a pullback from the highs with sellers slightly ahead
Range: ≈182 points — moderate volatility
Body: ≈65.75 points — sellers had the edge, but not by a wide margin
Upper Wick: ≈66.45 points — rejection showing up near the day high
Lower Wick: ≈49.75 points — some demand stepping in near the day low
🛡 5 Min Intraday Chart
⚔️ Gladiator Strategy Update
ATR: 225.92
IB Range: 64.95 → Small
Market Structure: ImBalanced
Trade Highlights:
09:42 Long Trade: Target Hit (R:R 1:1.52)
11:00 Long Trade: Target Hit (R:R 1:1.23)
12:13 Short Trade: Target Hit (R:R 1:2.31)
13:39 Short Trade: SL Hit
14:59 HERO ZERO Trade: Target Hit (R:R 1:6.2)
Trade Summary: Four out of five trades hit target today, with both longs early and the shorts after the reversal working out well. The Hero Zero trade in the last hour was the standout, closing out the session on a strong note. Days like this remind me why sticking to the system matters more than trying to predict every swing.
🧱 Support & Resistance Levels
Resistance Zones: 24460 | 24500 ~ 24520 | 24600
Support Zones: 24285 ~ 24235 | 24160 | 24125
🧠 Final Thoughts
“A gap can open the door, but it’s the follow-through that decides who walks through it.”
What stood out today was how quickly the rejection came once 24,500 was tested — six days of higher highs and higher lows, and the first real sign of hesitation showed up right there.
If 24,285 ~ 24,235 holds, the broader up move could still be intact, but a break below that zone might be the first real crack in this run. On the upside, 24,500 ~ 24,520 and 24,600 are the zones I’m watching for any fresh push higher.
Expiry days test patience more than strategy, and today was no exception. Sticking to the plan through both the rally and the fade felt like the right call, and that’s really all I can ask of myself.
✏️ Disclaimer
This is my personal digital diary and represents my own analysis and point of view. It is not financial advice; please consult a professional advisor before making any trading decisions.
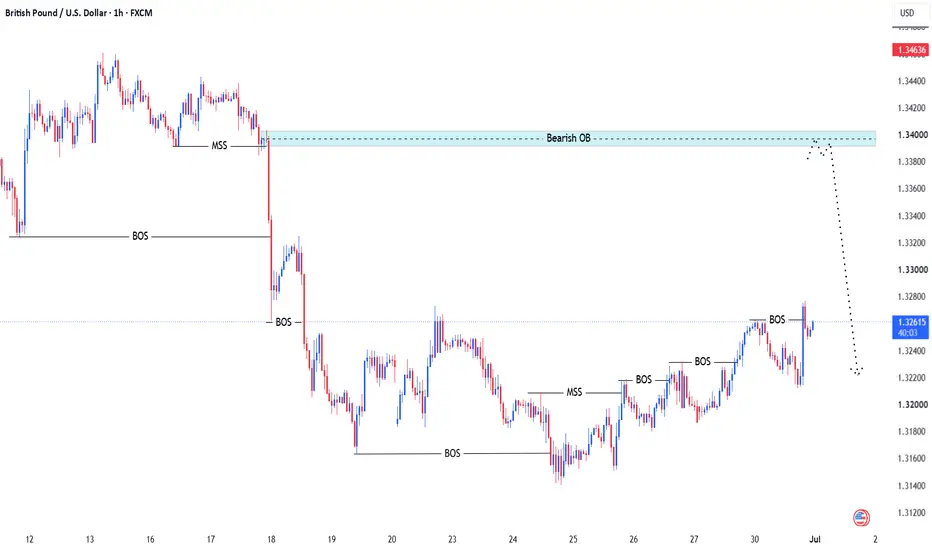
GBPUSD: Why 1.34000 is a High-Probability Selling Zone Right NowThe Big Picture:
The pound has been in a dominant bearish trend for some time. Even though we saw a small upward move recently, this appears to be nothing more than a classic Buy Side Liquidity grab — a trap for buyers before the real move lower resumes.
Key Technical Confluences at 1.34000:Strong Bearish Order Block sitting at this level (institutional supply area)
Multiple previous rejections from this zone
Overall market structure remains bearish with lower highs and lower lows
The recent minor bullish structure is losing momentum fast
Expected Scenario: Price is likely to reject from the 1.34000 region and continue the downtrend. This is one of the cleanest sell setups we’ve seen in recent sessions because of the strong confluence between the Bearish OB and the higher-timeframe bearish trend.
Trade Plan: Sell Entry: Around 1.34000
Stop Loss: Above 1.3425
Targets: First Target: 1.3360
Second Target: 1.3320
Final Target: 1.3280 – 1.3250
This setup offers excellent risk-to-reward with clear invalidation level.
This is not financial advice. Always do your own analysis and manage risk carefully.
EQT | Continued stock growth- Timeframe: Weekly
- Trade type: Buy stop order
- Price: 53.60
- Take Profit: Open
- Stop Loss: 50.57 (-5.70 %)
Idea: Long on a breakout above last week's high - bullish momentum continuation.
Entry: Buy stop above last week’s high.
Stop-loss: Below the low of the same candle.
If the weekly candle closes below this level, the trade is invalidated.
Take Profit: Trailing stop following the lows of new weekly candles.
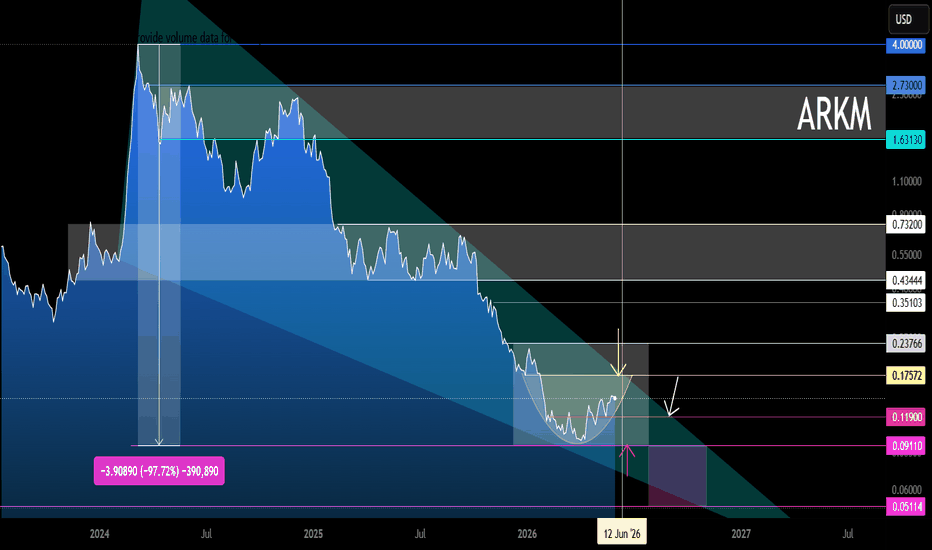
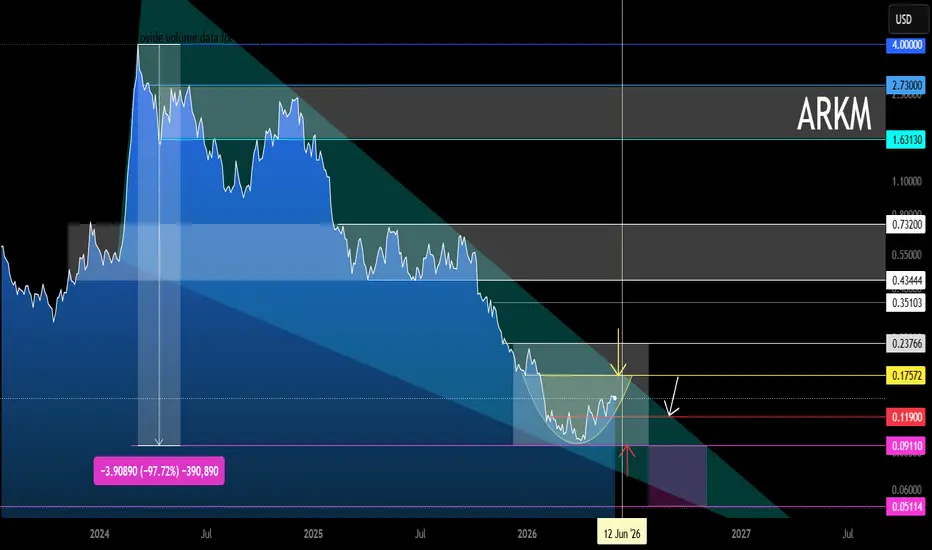
ARKM Main Trend. Wedge. Cup. Squeeze. 01/06/2026Logarithm. 3-day time frame. A descending wedge has formed in the main trend.
1️⃣🟢 A cup has formed in the local trend, pushing toward wedge resistance. There could be a impulse pump , driven by some fictitious positive news. It would be rational to use trigger orders for a breakout , and diversified limit orders if the breakout is false.
There could be a pullback from wedge resistance (not a breakout of the downtrend line):
2️⃣🔴 toward the support zone, and a horizontal channel could form;
3️⃣🔴 or an extremely negative scenario – entering the final zone of the descending wedge closer to August-September (optional), if there is no breakout and support from previous lows is broken.
AUDJPY - HTF Bullish ContinuationHigher timeframe remains bullish, with price breaking highs and closing above key levels, confirming bullish intent.
On the midterm, price swept internal liquidity and inducement, but that move was not enough to flip structure. Instead, it acted as a deeper engineering phase, taking out liquidity across a full range and mitigating a higher timeframe order block.
From there, I monitored midterm footprints and structure shifts. Price broke a significant midterm lower high, which aligned with sell-side liquidity being targeted.
Within this bullish expansion leg, price showed strong inefficiency — minimal meaningful pullbacks, signaling aggressive displacement.
As expected, price swept the full range, then flipped structure by breaking the higher high, confirming continued bullish structural intent.
This sequence suggests potential for another sell-side liquidity grab into an order flow / demand area before further upside expansion.
Until then, I’m simply tracking footprints and observing bullish behavior as liquidity is engineered and mitigated across key zones.
No forcing trades — just letting structure complete and waiting for confirmation.
Patience remains the edge.
Let’s see how price develops next.
GBPUSD - Bullish Framework HoldingTop-down analysis confirms a bullish higher-timeframe model is in play.
On the lower timeframe, I waited for structure to realign bullish — confirmed by a break of the prior lower high and a key structural level, followed by a pullback that swept sell-side liquidity. That sweep acted as the professional reset point.
Price held from that area, reinforcing higher-timeframe grip formation and maintaining bullish intent.
Since then, price has been forming bullish footprints, expanding toward mid-term highs and higher-timeframe liquidity targets above.
Trendline structure is acting as guardrails, guiding price behavior within the current bullish expansion phase.
Currently, I’m waiting for internal sell-side liquidity to be taken and for price to mitigate lower-timeframe order blocks beneath the recent lows. I’ve also marked a secondary deeper demand zone below the reactive area in case price seeks deeper liquidity before continuation.
Until then, I’m simply tracking bullish footprints and waiting for confirmation. No anticipation — just execution with structure.
Patience remains the edge.
EURGBP - update | HTF footprint viewPrice continues to decline, and I’m still tracking bearish footprint behavior on the higher timeframe. The broader structure remains intact.
I’m waiting for buyside liquidity to be taken into the upper inefficiency / supply zone. Once that area is tapped, I’ll drop down to lower timeframes for confirmation and look for trend continuation setups aligned with the higher timeframe bias.
Until then, I’m sitting on hands. No forcing. Just monitoring footprints and letting price deliver.
Patience is key. Still tracking every day.
Let’s see what the market prints next.
EURUSD - Higher Time Frame Bullish BiasHigher time frame remains bullish, even though lower time frame structure may appear bearish at first glance.
After price broke a higher time frame high, it began to rotate back into a mid-term range. That initial downside move looked like bearish continuation, but in context, it acted more as inducement—sweeping internal liquidity before price delivered into a higher time frame auction area (demand zone).
From that mitigation, price reacted and shifted mid-term structure, briefly breaking highs and showing bullish continuation, although without fully expanding beyond the higher time frame highs.
Price then formed a stronger mid-term high and retraced again, taking out internal liquidity and engineering further inducement before returning into a key Point of Interest (orange zone). This level aligned with a higher time frame liquidity area and previously marked demand.
After mitigation, price once again shifted mid-term structure, breaking minor lower highs and forming a new internal bullish leg. This reinforces the idea that the broader higher time frame bullish structure is still intact.
From here, the expectation is for price to first target internal mid-term liquidity and inducement levels before potentially rotating into the orange POI below for another mitigation phase.
If that occurs, I will look for lower time frame confirmation (break of minor structure) to support continuation toward higher time frame highs and mid-term highs.
Until then, I remain patient. No anticipation—only reaction to structure and liquidity delivery.
Patience builds clarity. Structure confirms intent. Follow the footprint, not the noise.
EURGBP- Bearish OutlookHigher time frame is showing a bearish mapping, with price currently taking out downside liquidity.
What I’m watching for next is a potential run into buy-side liquidity first—specifically a sweep of mid-term internal highs into the higher time frame supply / auction areas above.
If that expansion into buy-side liquidity happens, I’ll then look for confirmation on the lower time frame: a break of the minor higher low, signaling a shift back in alignment with bearish structure and footprints.
That shift would open the path for continuation lower, targeting mid-term lows and eventually higher time frame lows.
Until then, I’m sitting on my hands. No anticipation—only reaction to what price confirms.
Track structure, follow liquidity, stay patient
GBPJPY (GJ) - higher Time Frame OutlookAfter remapping and reassessing the higher time frame structure for the week, price has broken above a major higher time frame high, confirming strong bullish momentum.
Although price may continue pushing higher, I’m now watching for signs of exhaustion. My primary expectation is for price to first take out the internal mid-term liquidity before delivering into the auction area—my higher time frame Point of Interest (orange zone).
If price reaches that POI, I’ll shift my attention to the lower time frames, looking for confirmation through a break of the minor lower high. That structural shift would signal that buyers have regained control and that the bullish trend has been confirmed.
From there, I’ll be tracking price for another engineered internal liquidity leg into discounted territory before targeting the next higher time frame mid-term highs.
Until then, I’m staying patient. There’s no need to anticipate what price hasn’t confirmed yet.
Patience is key. Tracking remains the edge—let price reveal its intent, then execute with conviction.
USDJPY (U) - Higher Time Frame Bullish OutlookThe 4H higher time frame remains bullish.
Studying price, I noticed it first took out the previous mid-term lows before engineering liquidity and delivering into the mid-term Point of Interest (orange zone). That liquidity event provided the fuel for price to trade into a higher time frame area of interest.
At the POI, price responded with a strong wick rejection rather than full acceptance, suggesting a reaction from buyers instead of sustained selling pressure.
From that reaction, price lifted off the bullish POI and began rebalancing the previous bearish inefficiency. Based on previous observations, price could still revisit the orange POI for deeper higher time frame acceptance through candle-body closes before continuing higher.
For now, I’m treating the current mid-term high and mid-term low as the operating range. As long as price remains within that range, I’m focused on observing rather than anticipating.
If bullish momentum expands and price takes out the current mid-term highs, I’ll reassess the newly engineered liquidity and identify the next objective for continuation.
Until then, patience remains the priority. Tracking structure is still the edge—I’ll let price reveal its intent before committing to the next move.
Patience is key. Track the structure, trust the process, and let price do the talking.
BTC Analyses-1, [July 06, 2026Welcome to my page! I share daily technical analyses of Bitcoin and other charts here.
BINANCE:BTCUSDT
💡Market Analysis:
Bitcoin is currently consolidating between the defined key resistance and support areas. We are waiting for a clear breakout with a candle showing >50% body outside these bounds to confirm the next directional trend.
Key Support & Resistance:
Key Resistance: 63,346
Key Support Area: 60,840 - 61,286
🎯 Trade Entry & Exit Plan:
Entry : Breakout/Pullback of trendline or key zones with >50% candle body.
Stop Loss : Behind the last wave or the last breakout candle.
Take Profit : Minimum R:R 2, with further targets at major horizontal levels.
⚠️Risk Management:
Maximum 1% risk per trade.
❤️Please share your thoughts and comments on this analysis!
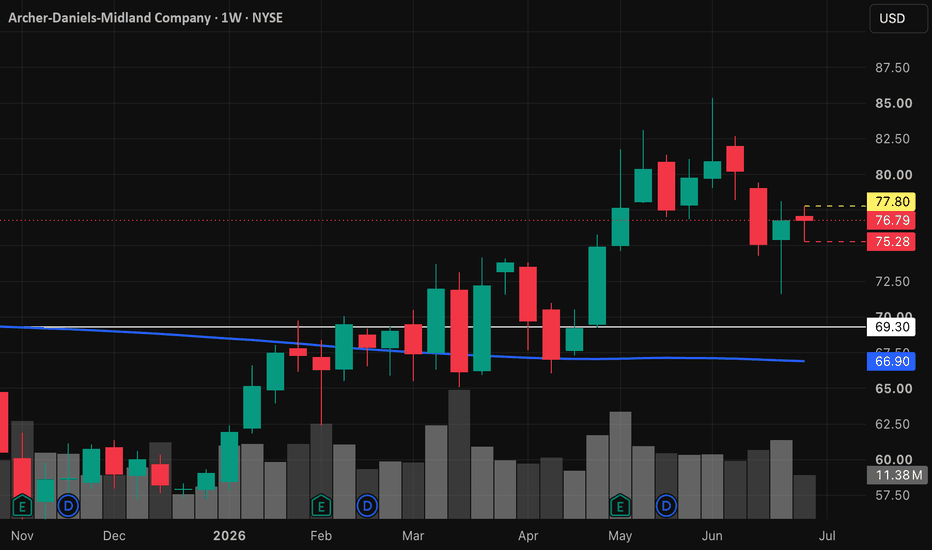
ADM | Continued stock growth- Timeframe: Weekly
- Trade type: Buy stop order
- Price: 77.80
- Take Profit: Open
- Stop Loss: 75.28 (-3.20 %)
Idea: Long on a breakout above last week's high - bullish momentum continuation.
Entry: Buy stop above last week’s high.
Stop-loss: Below the low of the same candle.
If the weekly candle closes below this level, the trade is invalidated.
Take Profit: Trailing stop following the lows of new weekly candles.
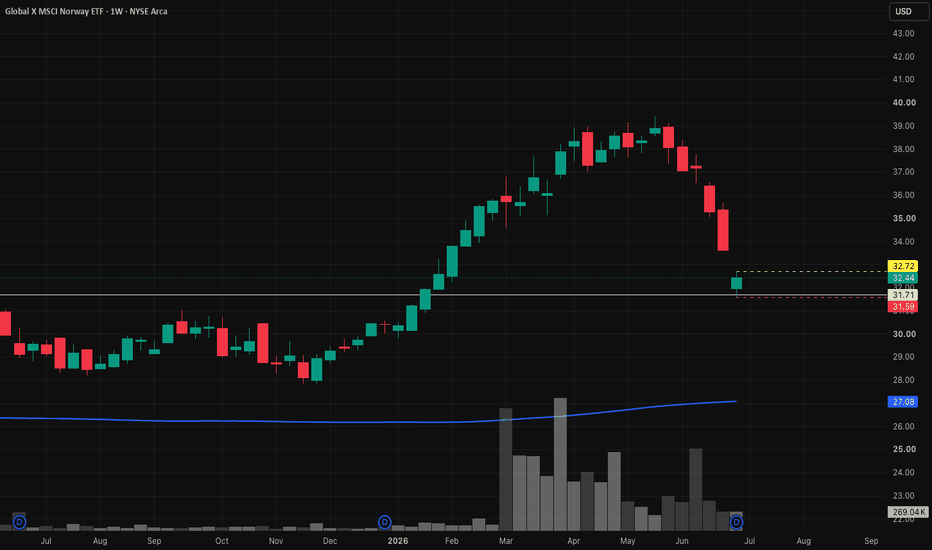
NORW | Continued growth ETF- Timeframe: Weekly
- Trade type: Buy stop order
- Price: 32.72
- Take Profit: Open
- Stop Loss: 31.59 (-3.40 %)
Idea: Long on a breakout above last week's high - bullish momentum continuation.
Entry: Buy stop above last week’s high.
Stop-loss: Below the low of the same candle.
If the weekly candle closes below this level, the trade is invalidated.
Take Profit: Trailing stop following the lows of new weekly candles.
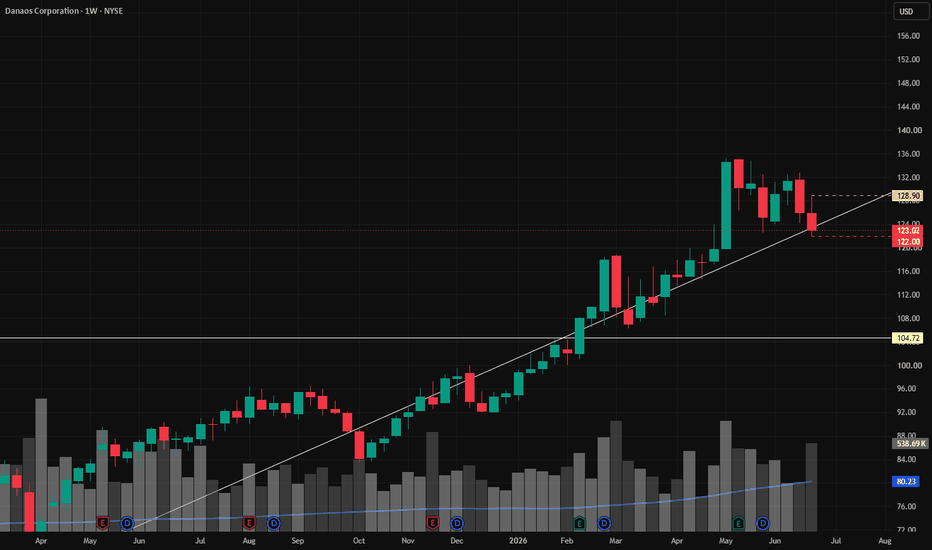
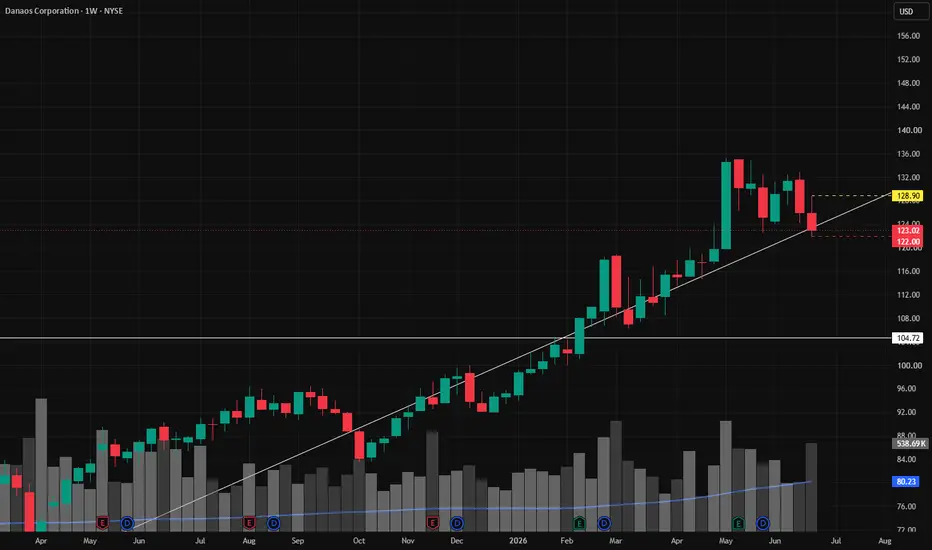
DAC | Continued stock growth- Timeframe: Weekly
- Trade type: Buy stop order
- Price: 128.90
- Take Profit: Open
- Stop Loss: 122.02 (-5.40 %)
Idea: Long on a breakout above last week's high - bullish momentum continuation.
Entry: Buy stop above last week’s high.
Stop-loss: Below the low of the same candle.
If the weekly candle closes below this level, the trade is invalidated.
Take Profit: Trailing stop following the lows of new weekly candles.
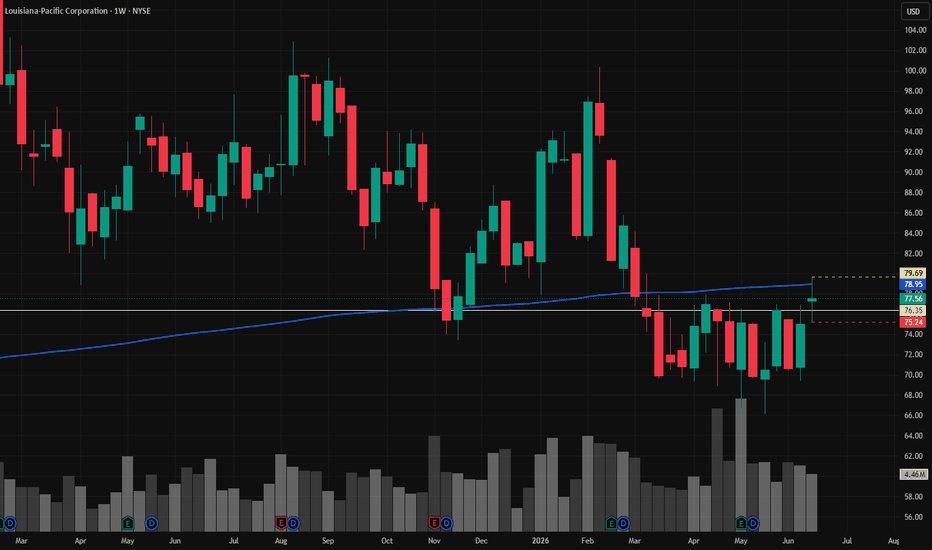
LPX | June, 2026 | The time to go long has come- Timeframe: Weekly
- Trade type: Buy stop order
- Price: 76.69
- Take Profit: Open
- Stop Loss: 75.24 (-5.60 %)
Idea: Long on a breakout above last week's high - bullish momentum continuation.
Entry: Buy stop above last week’s high.
Stop-loss: Below the low of the same candle.
If the weekly candle closes below this level, the trade is invalidated.
Take Profit: Trailing stop following the lows of new weekly candles.
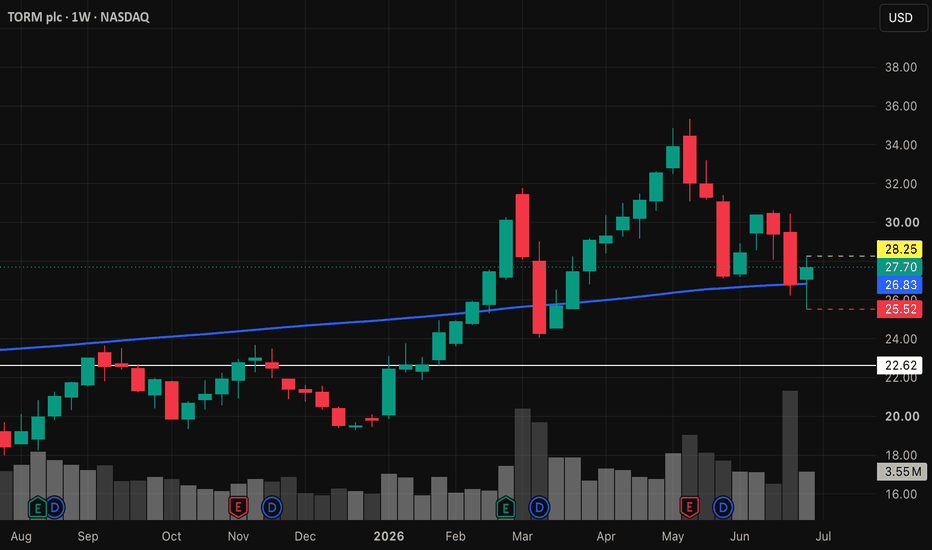
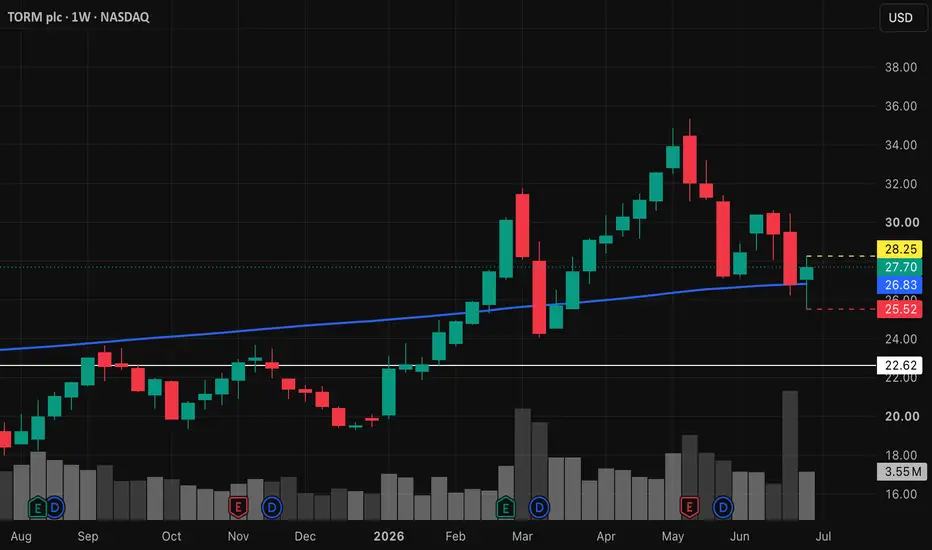
TRMD | Continued stock growth- Timeframe: Weekly
- Trade type: Buy stop order
- Price: 28.25
- Take Profit: Open
- Stop Loss: 25.52 (-9.70 %)
Idea: Long on a breakout above last week's high - bullish momentum continuation.
Entry: Buy stop above last week’s high.
Stop-loss: Below the low of the same candle.
If the weekly candle closes below this level, the trade is invalidated.
Take Profit: Trailing stop following the lows of new weekly candles.
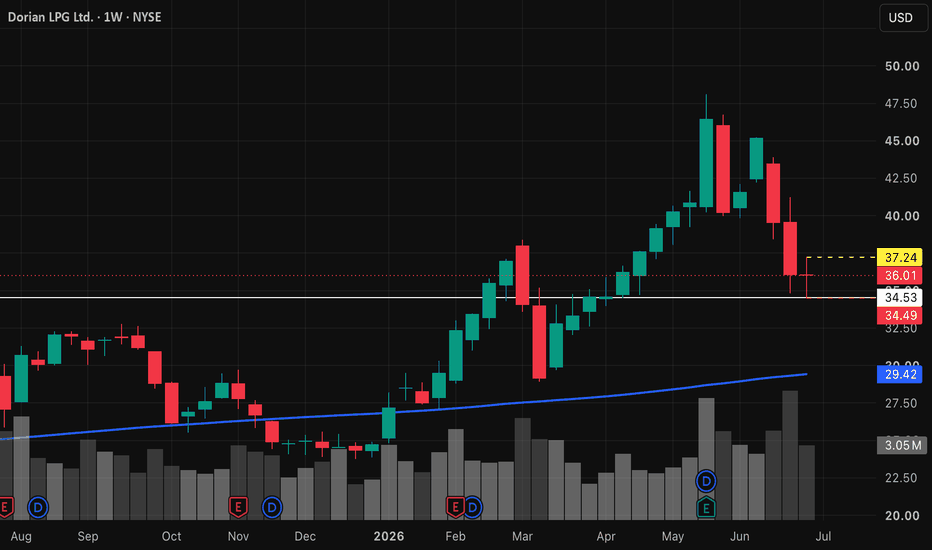
LPG | Continued stock growth- Timeframe: Weekly
- Trade type: Buy stop order
- Price: 37.24
- Take Profit: Open
- Stop Loss: 34.49 (-7.40 %)
Idea: Long on a breakout above last week's high - bullish momentum continuation.
Entry: Buy stop above last week’s high.
Stop-loss: Below the low of the same candle.
If the weekly candle closes below this level, the trade is invalidated.
Take Profit: Trailing stop following the lows of new weekly candles.