Advanced analysis techniques of gold candlestick chart
In the gold market, K-line charts are not only a tool for beginners, but also an important weapon for senior investors to conduct in-depth analysis and formulate trading strategies.
This article will explore the advanced analysis techniques of K-line charts in depth to help investors capture more profit opportunities in a complex and changing market.
📈1. Application of Trend Line
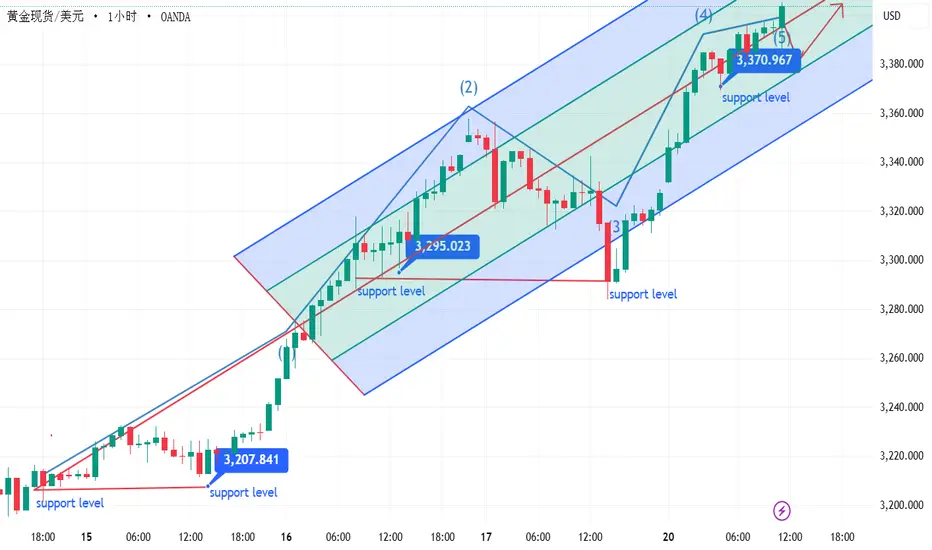
Drawing trend lines on a candlestick chart can help investors identify and track the long-term trend of the market. An upward trend line connects a series of low points, and a downward trend line connects a series of high points. Once the price breaks through these trend lines, it often indicates a reversal of the trend.
📝2. Identification of support and resistance levels
The frequently traded areas on the candlestick chart will form obvious support and resistance levels. These positions are important references when prices fall back, and are also important bases for investors to set stop-loss and take-profit points.
📊 3. Deepening of morphological analysis
In addition to the basic K-line patterns, the identification of complex patterns such as flags, wedges, triangles, etc. can provide investors with more accurate buying and selling signals. These patterns are often accompanied by changes in trading volume and are a direct reflection of the shift in market forces.
⏰4. Time cycle analysis
Combining K-line charts of different time periods (such as daily, weekly, and monthly lines) can comprehensively analyze the market from macro to micro. Long-term charts are used to grasp the general trend, while short-term charts are used to capture trading opportunities.
🥰5. Combining sentiment indicators with K-line
Market sentiment indicators such as the investor confidence index and panic index, combined with K-line chart analysis, can further verify the rationality of price trends and improve forecast accuracy.
📝Conclusion
Advanced analysis of gold candlestick charts requires investors to have a solid theoretical foundation and rich practical experience. Only by continuous learning and practice, and transforming theoretical knowledge into practical operation capabilities, can investors be at ease in the ever-changing gold market.