## NIFTY 50 – 1-Hour Chart Analysis## NIFTY 50 – 1-Hour Chart Analysis
1. Nifty is trading within a **rising channel**, maintaining a sequence of higher highs and higher lows, which indicates that the medium-term trend remains bullish.
2. The upper channel boundary around **24,500–24,600** has acted as a strong resistance zone, with multiple rejections confirming the presence of aggressive profit booking.
3. The horizontal support near **23,800** has been tested several times and has held firmly, making it a critical demand zo
Triangle
NZDCAD - Short-Term Resistance Before the Range High?NZDCAD has been trading within a well-defined range for an extended period, with price continuing to respect both the major support and resistance areas while developing a green symmetrical triangle.
After rejecting the lower support area, price recovered and is now approaching a smaller supply zone before reaching the upper boundary of the broader range.
⭕This supply zone may provide an opportunity to look for sell setups on lower timeframes, particularly if price shows signs of rejection be
BTCUSDT: Trendline Rejection Could Trigger the Next Bearish MoveHello everyone, here is my breakdown of the current BTCUSDT setup.
Market Analysis
BTCUSDT previously traded inside a descending triangle before breaking below support, confirming a strong bearish shift. After the decline, price recovered inside an ascending channel, but the rally stalled near the 64,800 Resistance Zone and the long-term descending trendline.
Currently, BTCUSDT is trading above the 60,000 Support Zone while remaining below the 64,800 Resistance Zone. The recent breakout abov
EURUSD - Retest of support at 1.143–1.140 before distribution FX:EURUSD is showing early bullish signals. The pair is breaking above the 1.1434 resistance cluster and the descending trendline, opening the door for a potential continuation higher
The latest FOMC minutes did not deliver a clear hawkish message, with markets pricing in only a 25–30% probability of a July rate hike. Meanwhile, the 1.1400 support continues to provide a solid base for a technical rebound. However, renewed geopolitical tensions in the Middle East continue to support the U.S
Bitcoin Buyers Stay in Control — Can Bulls Reach 64.8K?Hello traders! Here’s my technical outlook based on the current BTCUSDT (2H) chart structure. BTCUSDT previously traded inside a descending triangle, where repeated rejections from the resistance line confirmed strong selling pressure. After breaking below the 62,500 Buyer Zone, price entered a consolidation range before buyers regained control and launched a strong recovery. Currently, BTCUSDT is trading above the 62,500 Buyer Zone while remaining below the 64,800 Seller Zone. Price has broken
GOLD - Breakdown from consolidation. Bearish pressureFX:XAUUSD failed to extend last week's rally despite the temporary improvement in the fundamental backdrop. Following yesterday's geopolitical escalation, market sentiment has shifted again, putting renewed pressure on the metal
Gold recovered modestly on Wednesday after its recent decline, but gains remain limited by the stronger U.S. dollar. Market attention is now focused on the minutes from the June FOMC meeting, which could provide further clues about the Fed's rate outlook.
Additiona
QQQ Bearish Symmetric Triangle – Breakdown Setup with Increased NASDAQ:QQQ is forming a Bearish Symmetric Triangle on the daily chart after a series of lower highs and higher lows.
Key observations:
• Price is coiling inside the converging trendlines with decreasing volume
• A breakdown below the lower trendline would confirm the pattern and open the door for a measured move lower
• RSI is showing signs of weakening momentum
• TTM Squeeze is compressed, suggesting a volatility expansion is likely once the triangle resolves
This is a classic continuati
NZD/USD: Break, retest, rally?NZD/USD may be on the cusp of a bullish breakout from an ascending triangle, with a sustained move above 0.5724 potentially paving the way for a retest of 0.5774, a level that repeatedly acted as both support and resistance over recent months.
The pair failed to clear 0.5724 late last week, prompting a pullback towards the lower boundary of the structure. However, the backdrop has improved following the RBNZ's hawkish rate hike on Wednesday, reinforced by a surge in the BNZ Manufacturing PMI to
NASDAQ Falls Out of Triangle as Bears Takes ControlSince the beginning of June, the Nasdaq has been trading inside a pretty clean symmetrical triangle, with volatility gradually tightening as buyers and sellers reached a temporary balance.
Yesterday, price finally broke below the lower trendline, which shifts the short-term momentum in favor of the bears.
One thing that's worth mentioning is that it's very common to see a retest after the initial breakdown. Price often tries to climb back into the triangle, only to get rejected at the broken
EURUSD Short: Recovery Faces Selling Pressure Below 1.1460Hello traders! Here’s my technical outlook based on the current EURUSD (1H) chart structure. EURUSD previously traded inside a consolidation range before breaking below support, confirming a bearish shift. Price then continued lower inside a descending channel until buyers defended the 1.1400 Demand Zone, triggering a corrective rebound.
Currently, EURUSD is trading below the 1.1460 Supply Zone while holding above the 1.1400 Demand Zone. The recovery is approaching the long-term descending tren
XAUUSD: Reaches Decision Point – Resistance Trigger New SellingHello everyone, here is my breakdown of the current XAUUSD setup.
Market Analysis
XAUUSD previously traded below a long-term descending trendline while respecting a rising triangle support. After several failed attempts to break higher, price lost the triangle support and continued lower, confirming renewed bearish momentum. More recently, XAUUSD formed a consolidation range before breaking to the upside and rallying toward a major resistance area.
Currently, XAUUSD is trading above the 4,06
Gold Tests Major Trendline - Will XAUUSD Break or Reverse?Hello traders! Here’s my technical outlook based on the current XAUUSD (4H) chart structure. XAUUSD previously formed a rounding top before breaking below a major support line, confirming a bearish shift in market structure. After the decline, price found support near the 4,100 Buyer Zone and started a recovery while remaining below the long-term descending trendline. Currently, XAUUSD is trading above the 4,100 Buyer Zone while remaining below the 4,220 Seller Zone. The recent rebound has broug
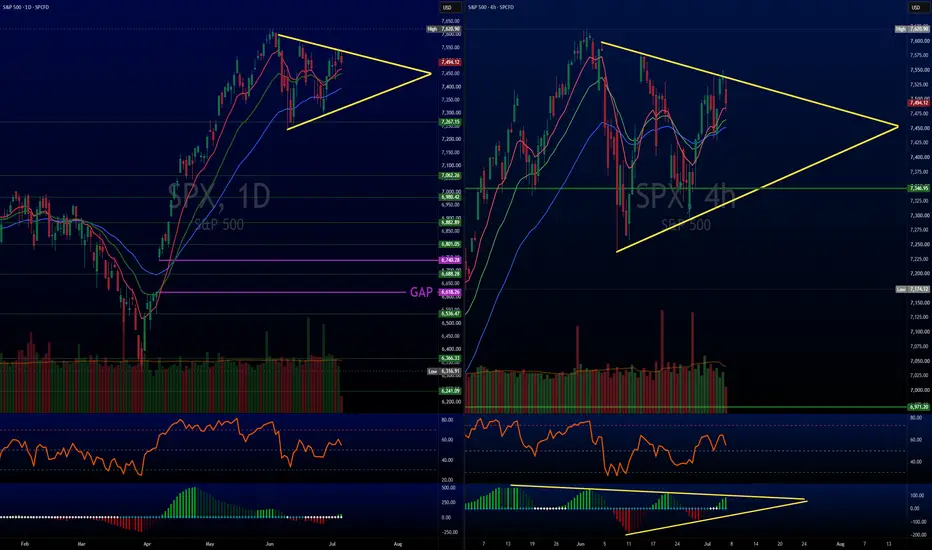
SPX Multi Timeframe Symmetrical Triangle Pt2When a market squeezes tightly into the final tip of a macro chart pattern, tracking the inner timeframes reveals a battlefield of false breakouts and rapid institutional positioning. Following up on our recent analysis of the S&P 500 SPCFD:SPX Symmetrical Triangle, the structural physics have shifted into an environment of extreme near term whipsaws.
1. The Daily Stalemate
Looking at the Daily macro chart, market has completely ground to a halt, flatlining right against its zero momentum lin
Inside the Robot’s MindAn interesting ticker brought to my attention today
Preliminary Info
Palladyne AI Corp. (PDYN) is a company specializing in AI software for robotics and automation (formerly known as Sarcos Technology and Robotics).
Explosive Revenue Growth
Palladyne has just confirmed its 2026 guidance, projecting revenues between $24M and $27M. This represents massive growth compared to the $5.2M recorded in 2025 (over +350%). This surge is mainly driven by:
- Acquisition Integration: The combination of tech
HYPEUSDT - Consolidation Before Further Growth BINANCE:HYPEUSDT.P is consolidating within both its local and global bullish trends. Technically, this phase appears to be a period of accumulation before a potential continuation of the uptrend
Bitcoin is currently caught between three major forces: the Fed's softer rhetoric, a reversal in ETF flows, and renewed geopolitical tensions in the Middle East. While Bitcoin remains in a countertrend correction within its broader bearish trend, HYPE continues to show relative strength. The market
360 ONE WAM Ltd. – Symmetrical Triangle Near Breakout360 ONE WAM is approaching a decisive point as price compresses within a Symmetrical Triangle on the weekly timeframe. After multiple months of consolidation, the stock is testing the descending trendline resistance while continuing to form higher lows, indicating growing buying pressure.
The narrowing price action suggests that a strong directional move may be approaching. A confirmed breakout above the triangle could pave the way for a retest of the previous swing high and the highlighted tar
GBPJPY: Important Breakout 🇬🇧🇯🇵
As I predicted earlier, GBPJPY went up strongly.
The price broke a major daily supply area.
The broken structure turned into a potentially strong support.
I think that the pair will continue rising and will reach 217.5 level soon.
❤️Please, support my work with like, thank you!❤️
I am part of Trade Nation's Influencer program and receive a monthly fee for using their TradingView charts in my analysis.
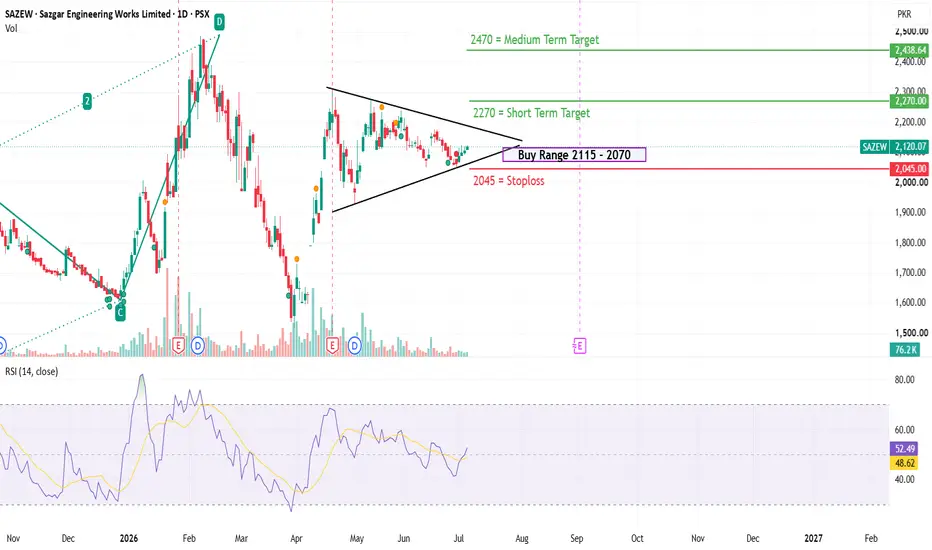
SAZEW gaining MomentumSAZEW – Symmetrical Triangle Consolidation Setup
Market Structure:
SAZEW is consolidating tightly near the apex of a high-probability **Symmetrical Triangle** pattern on the Daily timeframe. Volatility is contracting heavily, signaling an impending breakout. The RSI holding structural support right at the 50-midline indicates a balanced auction ready for expansion.
Execution Parameters:
Bias: Long on structural confirmation
Execution Range (Entry): 2,070 – 2,115 PKR
Invalidation (SL): 2,045
Nasdaq 100: Coiled beneath the highsOur Nasdaq 100 contract has spent the past month consolidating the mammoth bull run from late March through to early June, trading within what resembles a symmetrical triangle.
Momentum has shifted back neutral, with RSI (14) drifting back to 50 with MACD sitting beneath its signal line after crossing below in early June.
While symmetrical triangles imply two-way directional risk, the preceding trend provides important context. It follows a powerful rally that lifted the price above all the ke
GOLD - A pullback before a potential rise to 4220 Following the breakout above the 4100 consolidation range and the recent rally, ICMARKETS:XAUUSD has entered a corrective phase. The geopolitical and fundamental backdrop remains unstable
Gold staged a strong recovery after weaker-than-expected U.S. employment data shifted Fed expectations from hawkish to more neutral. The probability of a September rate hike has fallen from 66% to around 53–55%, while the U.S. dollar has stalled and Treasury yields have declined, creating favorable condit
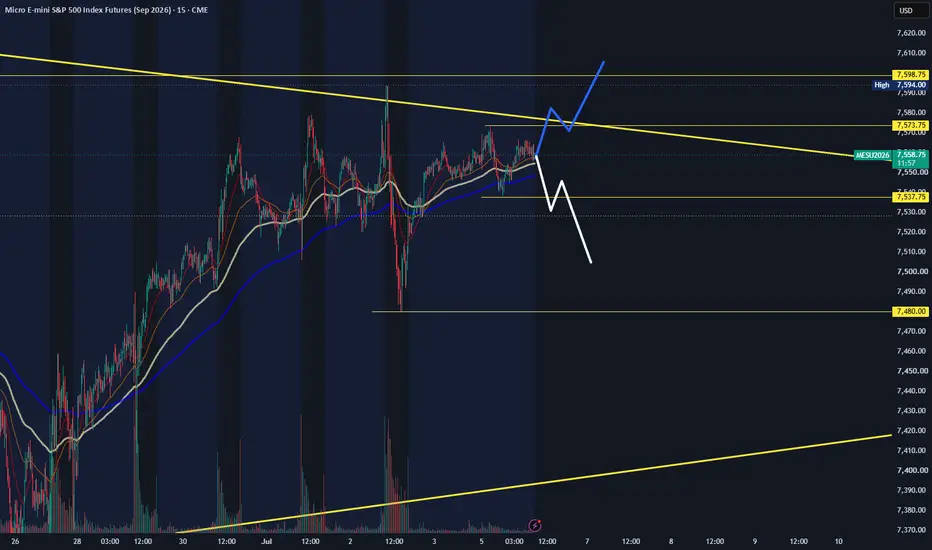
MESU July 6: Triangle compression, pullback to 7480?MESU analysis for Monday, July 6
MESU is still trading near the upper resistance area and under the trendline from last week. From the higher-time-frame view, price still looks trapped inside a triangle compression, so for me today favors a pullback-first scenario rather than an easy breakout.
On the 4H chart, the main downside level I’m watching is 7480. That is the first area where I expect buyers may try to step in again if price starts rotating lower.
On the 1H chart, the key trigger leve
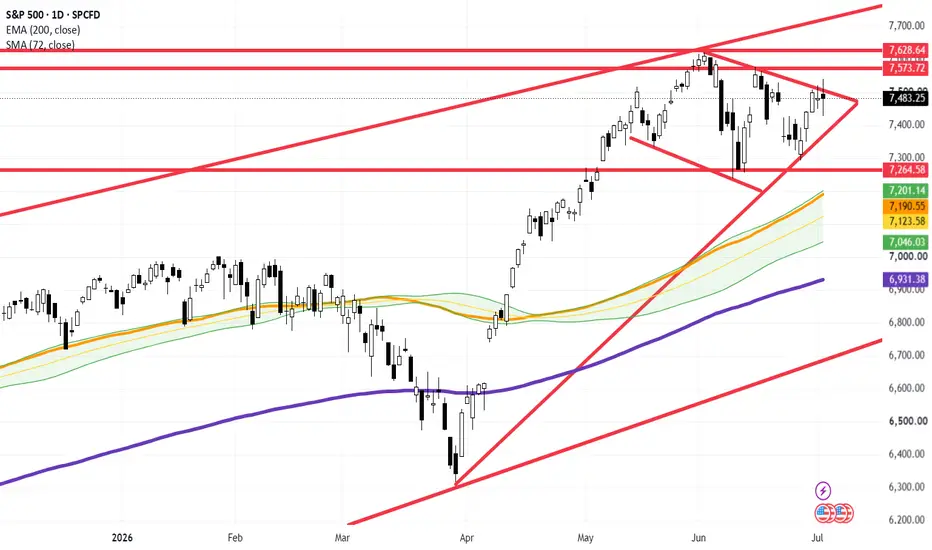
S&P 500 ($SPX) Daily Update: Index Remains Locked in SymmetricalS&P 500 ( SPCFD:SPX ) Daily Update: Index Remains Locked in Symmetrical Triangle – Tactical Range-Playbook Rules Until Breakout Confirmation
### 🇺🇸 S&P 500 Index ( SPCFD:SPX ) Mid-Weight Macro Brief (Ref: SPX_2026-07-06_10-22-10.png)
We are releasing an essential structural update on the S&P 500 Index ( SPCFD:SPX ) on the Daily (1D) time matrix. Following a brief breakout attempt last week, aggregate institutional order flow failed to secure structural acceptance above the local descending res
MARI ENERGIESMARI (Mari Energies Limited): Symmetrical Triangle Breakout
MARI has officially transitioned into a strong bullish structure following a definitive upside breakout from a multi-month Symmetrical Triangle consolidation pattern. This explosive price expansion is technically validated by a massive surge in trading volume (1.17M), signaling robust institutional accumulation rather than a market fakeout.
Momentum indicators are in full alignment with this move. The MACD has executed a fresh bullish