GOLD - The pressure of the global bearish trendICMARKETS:XAUUSD is trading near the key daily support level of 4,510; the reaction within the long squeeze is weak, and the market continues to maintain a bearish structure. Meanwhile, the dollar is stagnating
Gold received support from geopolitical optimism on Wednesday, but the Fed’s hawkish stance and the possibility of a breakdown in negotiations are holding back gains. Today’s PMI data and developments regarding Iran will determine whether gold can hold above $4,600
Technically, the market is under pressure from bears within the medium-term trend. Locally, the focus is on two key triggers: the control point and the liquidity zone at 4,540. The second key zone is the resistance of the current local range at 4,588–4,607.
Resistance levels: 4,540, 4,588, 4,607
Support levels: 4,510, 4,565, 4,400
Locally, the dollar is stagnating due to geopolitics, but at the same time, consolidation is forming above key support, which is generally putting pressure on the metal. After hitting a new low, gold is forming a correction and closing within the 4465–4588 range; the reaction from the bulls is relatively weak. A short squeeze at 4540 (second trigger at 4588) could trigger a decline. A close below 4510 could trigger a drop to 4400
Best Regards, R. Linda!  Short
Short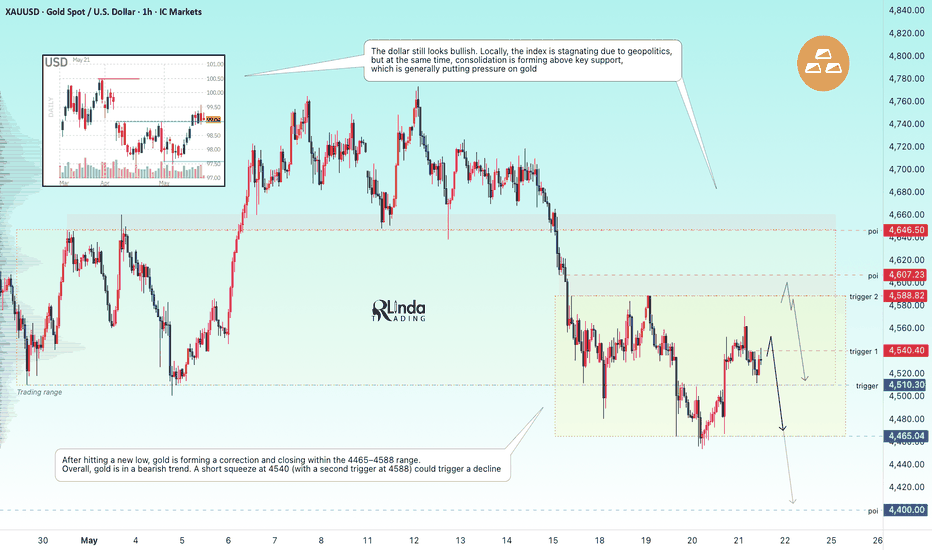
Gold Running Out of RoadDespite falling bond yields, a slight softening in dollar and buoyant risk appetite, gold hasn’t been able to capitalise in this much friendlier market environment; perhaps there’s a message in that?
The price finds itself coiling within a compression structure having entered it from above, warning that if there is to be an eventual breakout, it may be to the downside rather than upside. However, with the oscillators more neutral than bearish in their messaging on the H4 timeframe, price action carries greater weight on when and if to act.
Should we see a clean downside break of the structure, shorts could be set with a tight stop above the former uptrend for protection, targeting $4544 where the structure originally formed. A break of that level would open the door for a more pronounced unwind towards the April 27 swing low of $4352.
But if the price stages a bullish breakout of the structure, it would also allow for longs to be set with a tight stop beneath the former downtrend, targeting $4587 initially with $4640 another option after that.
Beyond technicals, gold continued to demonstrate a tighter relationship with riskier asset classes than havens when it comes to directional movements, meaning the chances of a breakout sticking would likely be improved by complementary risk appetite across broader markets.
Good luck!
DS  Long
Long
 Short
Short
 Long
Long
 Long
Long
GOLD - Pre-break consolidation around 4500 ICMARKETS:XAUUSD is under pressure from a bearish trend on both the local and global scales. The strong dollar is attracting capital. The market is digesting the latest developments surrounding the U.S.-Iran conflict
The market did not buy into the “TACO” narrative, remaining cautious. Geopolitics is at an impasse, which is also putting pressure on gold through high oil prices.
The inflation shock on May 12–13 (CPI 3.7% y/y, PPI 6.0% y/y) has completely ruled out expectations of rate cuts in 2026, triggering a flight to safe-haven assets (the dollar).
Gold’s next move depends on developments in the Middle East. If stagflation risks return to the forefront, U.S. bond yields may resume their rise, putting further pressure on the non-yielding yellow metal
Resistance levels: 4588, 4607, 4646
Support levels: 4510, 4479, 4400
Globally, the focus is on the key support level at 4510. A break below this level could trigger a further decline toward 4400. However, locally, gold is consolidating between 4510 and 4588 and may remain within these boundaries for some time, testing resistance before falling.
Best Regards, R. Linda! Short 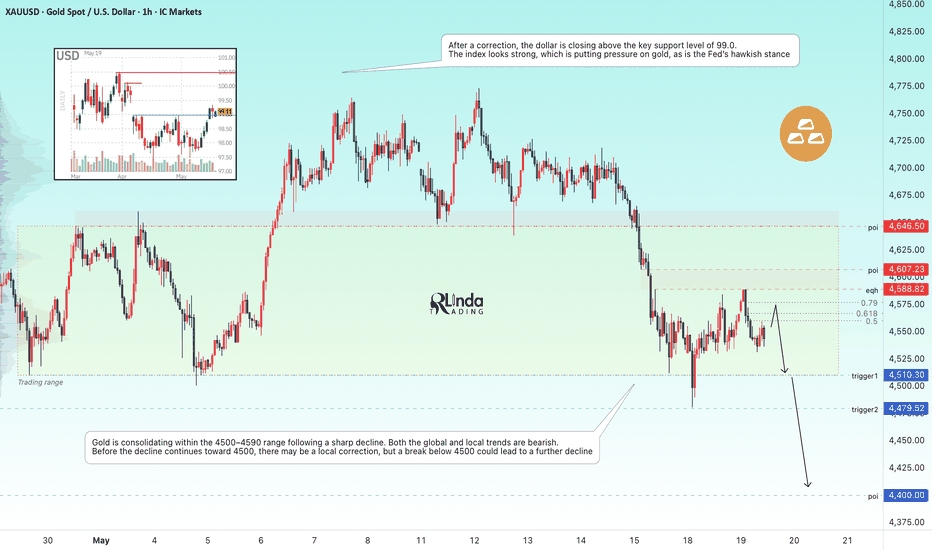
 Long
Long
 Long
Long
 Long
Long
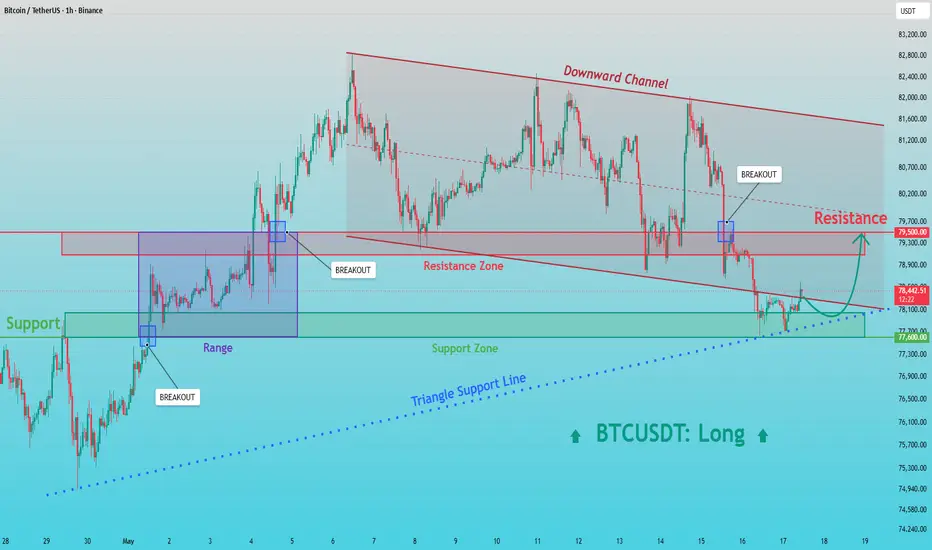
BTCUSDT: Price Holds Above 77,600 While Buyers Regain ControlHello everyone, here is my breakdown of the current BTCUSDT setup.
Market Analysis
Bitcoin previously traded inside a descending channel, confirming short-term bearish pressure. After several failed attempts to break above the resistance zone, price declined toward the lower boundary of the structure and formed a rising triangle support line near the 77,600 buyer zone.
Currently, BTCUSDT is trading above the 77,600 support zone while remaining below the 79,500 resistance level. Price recently rebounded from the triangle support structure and is attempting to recover after a strong bearish impulse, signaling that buyers are becoming active near the lower boundary of the pattern.
My Scenario & Strategy
As long as BTCUSDT remains above the 77,600 support zone and continues to respect the ascending triangle support line, the bullish recovery scenario remains valid. A continuation higher could push price toward the 79,500 resistance zone (TP1).
However, if price breaks below the 77,600 support level and loses the triangle support structure, the bullish outlook would be invalidated, opening the path for a deeper bearish continuation.
That’s the setup I’m tracking. Thank you for your attention, and always manage your risk.  Long
Long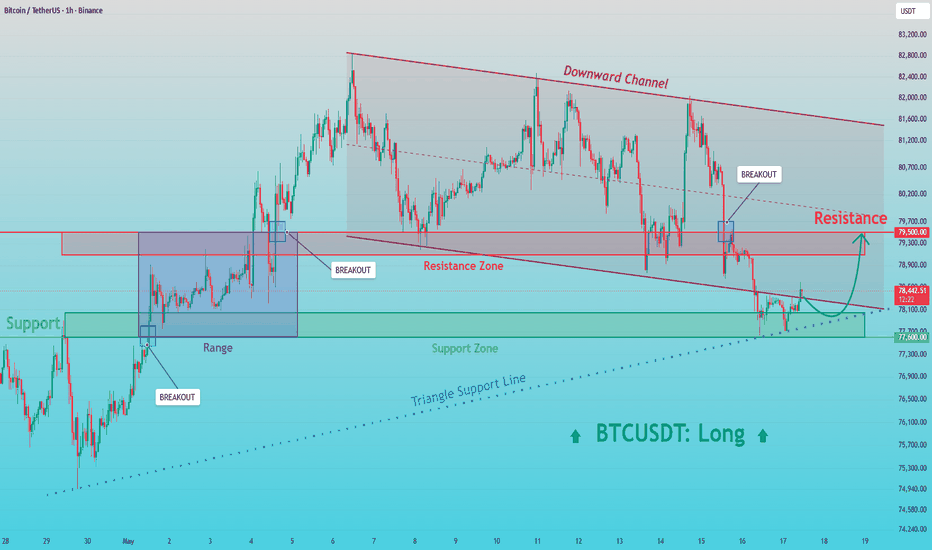
GOLD - Bear market. Trigger at 4,510 ICMARKETS:XAUUSD is under pressure again. The market is bearish. A false breakout of the trend resistance triggered a 3% drop on Friday; it will test key support. Friday’s session is closing on a weak note for the market...
The dollar has entered a bullish range. Momentum remains intact. The market is pricing in interest rate hikes; a new batch of “hot” economic data could support the index’s growth. The nearest catalysts are the release of the minutes from the Fed’s May meeting on May 20 and PCE data on May 28. Escalating geopolitical tensions will push the dollar even higher, intensifying pressure on gold.
Technically, gold is under pressure. The market is testing 4510; a close below this support level will open a new range of 450–4400 (4350). A close below 4510 could become a technical driver for the continuation of the decline
Resistance levels: 4588, 4607, 4646
Support levels: 4510, 4400, 4350
From the opening of the session, the market may form a local pullback aimed at liquidity hunting. As part of the correction, gold may test the resistance zone of 4588–4607 or the upper boundary of the range at 4646 before continuing its decline. A breakdown, close, and consolidation below 4510 could trigger a continuation of the decline.
Best Regards, R. Linda! Short 
 Short
Short
Best Price Action Pattern For GOLD Trend Following Trading
This bullish pattern is very powerful .
Being spotted on a daily/4h/1h, any time frame, it will help you to accurately predict a strong bullish movement on Gold.
In this article, I will teach you to identify a buying volumes accumulation on Gold chart and as a bonus, I will show you how I predicted a bullish rally with this price action pattern.
The initial point of this pattern will be a completion point of a strong bullish impulse.
At some moment, the price finds a strong horizontal resistance, stops growing and retraces .
The second point of the pattern will be a completion of a retracement.
It should strictly be a higher low - it should be higher than the low of an initial bullish impulse.
After a retracement, the price should return to a horizontal resistance and set an equal high, that will be the third point of the pattern.
Then, the price should retrace AT LEAST one more time from a horizontal resistance and set a new higher low.
After that, the price should set one more equal high.
3 equal highs and 2 higher lows will compose a bullish accumulation pattern.
Please, note, that the price may easily set more equal highs and more consequent new higher lows and keep the pattern valid.
Above is the example of a bullish accumulation pattern on Gold on an hourly time frame. The price set 3 equal highs and 3 consequent higher lows.
This pattern will signify the weakness of sellers and the accumulation of buying volumes.
The point is that each consequent bearish price movement from a resistance is weaker than a previous one. It means that fewer sellers are selling from the resistance and more buyers start buying, not letting sellers go lower.
In our example, we can clearly see the consequent weakening, bearish price movements.
This pattern indicates a highly probable breakout attempt of the resistance. A candle close above that provides a strong bullish signal.
The broken resistance will turn into support and will provide a safe point to buy the market from.
In our example, the market broke the underlined horizontal resistance and closed above that. It indicates the completion of a bullish accumulation and a highly probable bullish trend continuation.
You can see that Gold retested a broken structure and then a strong bullish wave initiated.
In a strong bullish market that we currently contemplation on Gold, this bullish pattern will provide a lot of profitable trading opportunities.
No matter whether you are scalping, day trading or swing trading Gold, this bullish accumulation pattern will help you to predict long-term, mid-term and short-term bullish movements.
❤️Please, support my work with like, thank you!❤️
I am part of Trade Nation's Influencer program and receive a monthly fee for using their TradingView charts in my analysis. Education 
The Illusion of Funded Capital: Anatomy of the Prop FIrm modelThe exponential growth of retail proprietary trading firms (*prop firms*) has fundamentally altered how retail traders perceive access to market capital. The initial premise is highly appealing: pay a nominal, upfront evaluation fee to secure an operational loss limit (*drawdown*) that is 10 to 20 times greater than the initial outlay. From a strict personal risk management perspective, this setup appears to be an optimal asymmetric bet.
However, a structural, financial, and operational analysis of this business model reveals an architecture identical to that of the commercial gambling industry.
---
## 1. Statistical Asymmetry and the True Source of Revenue
Retail prop firms operate under an actuarial model highly similar to insurance companies or casinos: their financial viability depends entirely on the failure rate of the participants.
* **The Real Success Rate:** Audited data derived from regulatory liquidations and legal proceedings (such as the CFTC cases against major industry players) demonstrate that **fewer than 1% of applicants (approximately 0.7%) ever reach their first payout**.
* **Monetizing Failure:** The primary revenue stream for these entities does not originate from net capital gains generated in the live market. Instead, it is fueled almost exclusively by the application and evaluation fees (*challenge fees*) paid by unsuccessful traders.
---
## 2. The Simulation Model (B-Book) and Structural Conflict of Interest
The vast majority of retail prop firms do not route or replicate their traders' orders into the actual interbank market or live exchanges. They operate within a pure simulation environment (*B-Book*).
* **Absence of Hedging:** Because there is no real-market hedging (*live replication*) of the positions, payouts distributed to profitable traders are financed directly out of the cash flow generated by the challenge fees of losing traders.
* **The Zero-Sum Incentive:** This creates a structural conflict of interest. To the firm, a consistently profitable trader is a pure financial liability, not an asset. The firm’s net profit increases when the user breaches their account rules and forfeits their balance.
---
## 3. Operational Friction and Technical Asymmetry
To accelerate the failure rate of traders who demonstrate statistical consistency, the simulated environment is frequently manipulated via algorithmic friction. These tools alter price execution and risk parameters to ensure the house edge is maintained.
* **Artificial Slippage and Spread Widening:** Unlike a regulated broker connected to Tier-1 liquidity providers, prop firms control the proprietary data feed. Artificial slippage (price degradation) and the sudden, discretionary widening of spreads during high-volatility events are deployed to trigger stop-loss orders that would remain untouched in an efficient, live market.
* **Induced Latency and Simulated Outages:** Brief, engineered server disconnections during critical macroeconomic releases or market opens prevent active trade management, forcing the trader to maintain involuntary risk exposure.
* **The Mathematics of the Trailing Drawdown on Equity:** This is the most aggressive statistical optimization tool in the industry. While traditional drawdown is calculated based on the closed balance of the previous day, a trailing drawdown on equity tracks the highest peak of unrealized profits (*floating equity*).
> **Example of Trailing Equity Drawdown:** If a $100,000 account opens a position that floats to +$5,000 but subsequently retraces and is closed at breakeven ($0), the maximum loss limit of the account permanently locks onto that $5,000 floating peak. The trader has lost $5,000 of their allowable drawdown space without realizing a single dollar of actual financial loss. This drastically narrows the operational margin, mathematically guaranteeing an increased probability of account termination.
* **Asymmetric and Inflated Swap Fees:** For swing traders holding positions overnight, firms frequently apply artificially inflated or multidirectional financing costs (*swaps*). This erodes the mathematical expectancy of medium-to-long-term strategies, turning winning setups into net losses purely through maintenance costs.
---
## 4. Administrative Suffocation of Profitable Operators
When technical hurdles fail to eliminate an advantage player, the firm transitions from automated friction to unilateral administrative intervention.
* **Discretionary Risk Restrictions:** Once a trader demonstrates a persistent payout history, the firm often modifies account parameters unilaterally—such as restricting the maximum risk per trade to a marginal threshold (e.g., 1%) or slashing available leverage. This effectively neutralizes the trader's edge.
* **Deliberate Payout Delays:** The withdrawal process is frequently subjected to prolonged, unjustified compliance audits. The objective is psychological: inducing fatigue and encouraging the trader to continue operating the account under psychological stress while waiting for funds, significantly increasing the likelihood of an unforced error.
* **Exploitation of Metadata (IP and VPN Bans):** Lacking valid technical grounds to ban a profitable operator, compliance departments often weaponize IP logs or Virtual Private Network (VPN) usage. The trader is formally accused of "account sharing," "suspicious access," or "IP latency arbitrage"—serving as a standard administrative pretext to deny payouts and confiscate accumulated earnings without recourse.
---
## 5. The Gambling Taboo and the "Right of Admission"
Within the financial retail community, there is a profound taboo surrounding the word *gambling*. Most market participants prefer to view trading as a purely academic, analytical endeavor. However, in terms of probability theory, professional trading is the exact functional equivalent of professional advantage play (such as card counting in blackjack or quantitative sports betting). It is the exploitation of a positive expected value ( SEED_ALEXDRAYM_SHORTINTEREST1:EV > 0$) through strict capital allocation.
In a commercial casino, any player who demonstrates a persistent mathematical advantage is banned via the "right of admission." The retail prop firm industry executes the exact same defensive mechanism:
* **Ambiguous Terms of Service (T&C):** Operating as technology service providers rather than regulated investment firms, their legal contracts contain intentionally vague clauses prohibiting "aggressive strategies," "toxic trading style," or "exploitative patterns."
* **Unregulated Environment:** Because these firms operate outside the jurisdiction of major financial regulators (such as the SEC, CFTC, or ESMA), consumers lack institutional protection. This regulatory void is precisely why major jurisdictions have increasingly restricted or banned these entities from soliciting citizens within their borders.
* **Reputation Management and PR Networks:** To counter legitimate exposure, the industry allocates millions of dollars toward affiliate marketing and reputation control on platforms like Reddit and Discord. They utilize network nodes and sockpuppet accounts to systematically discredit the testimonies of traders whose accounts were wrongfully terminated.
---
## Conclusion
The modern retail prop firm ecosystem must be approached with the exact same mathematical skepticism one would bring to a high-limit blackjack table. While it is entirely possible for a disciplined operator to extract short-term capital from these entities, it must be done under the absolute realization that the system is structurally, technically, and legally rigged to ensure the house wins over a sufficient sample size.
When an entity offers to absorb virtually all your financial risk for a small entry fee, the structural risk has not disappeared; it has simply been transformed into counterparty risk.
*This post was fully authored by me and enhanced with AI. Education