INTRACO - Buyers Face Key Resistance!INTRACO is a Bangladesh-based company operating CNG refueling stations across the country. The company also provides refueling and maintenance services and has expanded its operations through several subsidiaries. It was established in 2007 and is listed on the Dhaka Stock Exchange.
From a broader perspective, price remains bullish, continuing to trade inside the blue ascending channel for an extended period.
After rejecting the blue support area and the lower boundary of the channel, price t
AOL OutlookThe chart paints a constructive picture. The demand zone held, the trend reversed, and momentum (as indicated by the MA crossover and BMS) has turned bullish. As long as the price continues to respect the upward channel's lower boundary and stays above the moving averages, the 24 BDT target seems like a reasonable next objective.
That said, the stock has already rallied substantially from the demand zone lows (~12 BDT to ~18 BDT) — so risk management remains important, especially if the channel
LANKABAFIN OutlookThe stock is consolidating after a strong rally. A clean break above 22–24 could open a run toward 26–30. A breakdown below 17 would weaken the bullish structure.
The chart suggests the stock is in a bull market correction phase — the long-term trend is up, but price is respecting the resistance zone and may need time or a catalyst to break higher.
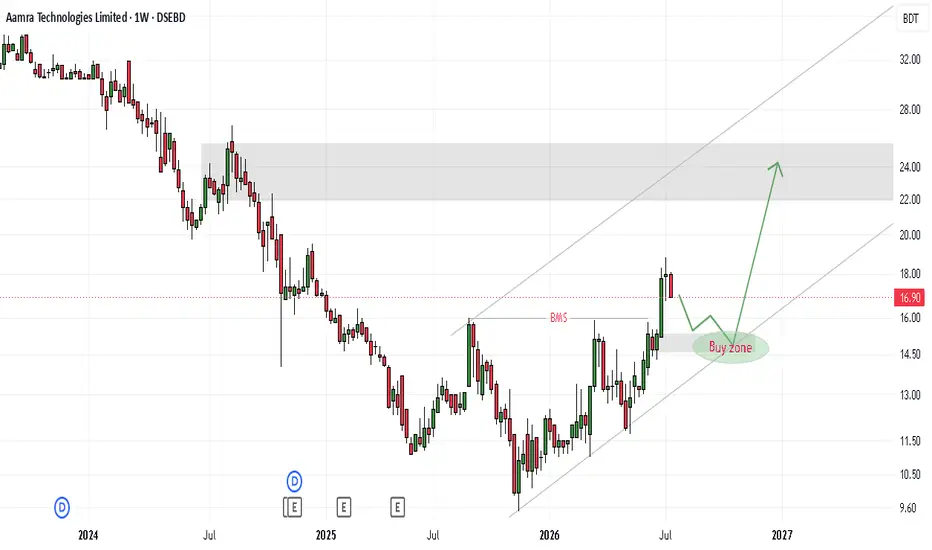
AAMRATECH OverviewPrice appears to be in a healthy pullback within the uptrend after reaching the ~20.50 area. This is normal profit-taking / retest behavior before a potential continuation toward the channel resistance at ~23–24.
Bullish scenario: Price holds above ~15.50 and resumes upward within the channel toward 20.50 → 23–24.
Bearish scenario: Breakdown below the lower channel support (~13.50) would invalidate the uptrend and risk a return to the Buy Zone.
Summary
AAMRATECH has transitioned from a prolonged
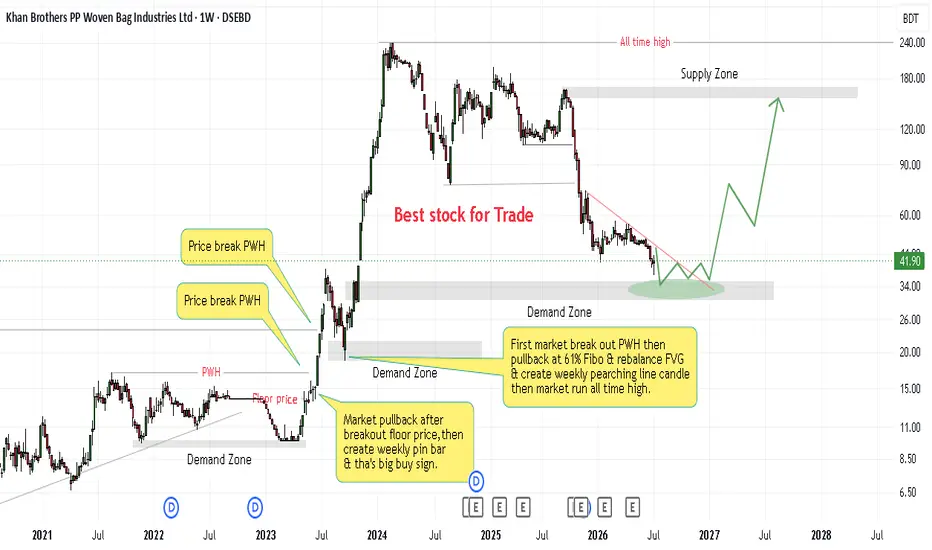
KBPPWBIL OutlookKBPPWBIL shows a classic boom-bust-reaccumulation setup. The stock surged, topped out, and has been declining back toward where it started. The thesis is that it will base around 50–60 BDT before launching another leg up toward 160+.
This is a high-risk, high-potential-reward pattern. The projected 200–300% return is compelling, but the stock must first complete its decline and show signs of basing. Waiting for confirmation (higher lows, volume expansion, trendline break) inside the Buy Zone wo
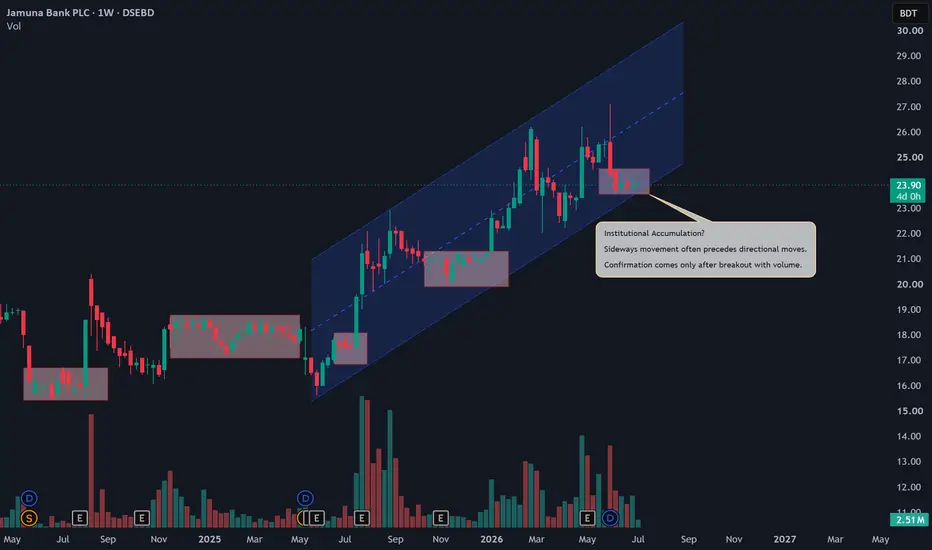
Another accumulation phase is developing.Over the past two years, similar sideways structures have repeatedly been followed by strong bullish expansions.
Will history repeat?
Nobody knows.
But one thing is certain:
📈 Markets alternate between Accumulation → Expansion → Distribution → Correction.
Right now, Jamuna Bank appears to be in another accumulation phase inside an established rising channel.
The next move will depend on whether buyers can break the current range with convincing volume.
Price first. Opinion second.
Points
The trend deserves more respect than opinionsIDLC Finance has maintained a sequence of higher highs and higher lows after confirming several bullish Breaks of Structure. Price is now approaching a long-term resistance trendline, making the coming weekly candles particularly important. Rather than predicting, I prefer to observe how price reacts at key levels. A confirmed breakout would strengthen the bullish outlook, while rejection could lead to a healthy pullback toward the demand zones before the next move.
City Bank in front of wild move ?City Bank has closed the monthly candle above a significant volume-weighted average price (VWAP) level.
Today's candle is going to form a bottom wick. I would rather prefer it as a long tail rather than a short tail, suggesting a successful retest of the breakout level.
If this interpretation holds, we may see a bullish (green) monthly candle.
Since we don't have sufficient historical data at this level, it's difficult to project a price target. However, strong buying volume could confirm the
BDTHAI Pattern Recognition
1. Demand Zone (2025)
Price found strong buying interest around 8.50–10.00 BDT
This zone acted as a base before the major uptrend began
Multiple touches suggest institutional accumulation
2. Breakout & Uptrend Channel
After leaving the Demand Zone, price entered a steep upward-sloping channel (mid-2026)
The channel shows higher highs and higher lows — textbook bullish structure
Volume likely expanded during the breakout (not visible but typical)
3. Buy Zone (13.50 – 15.50
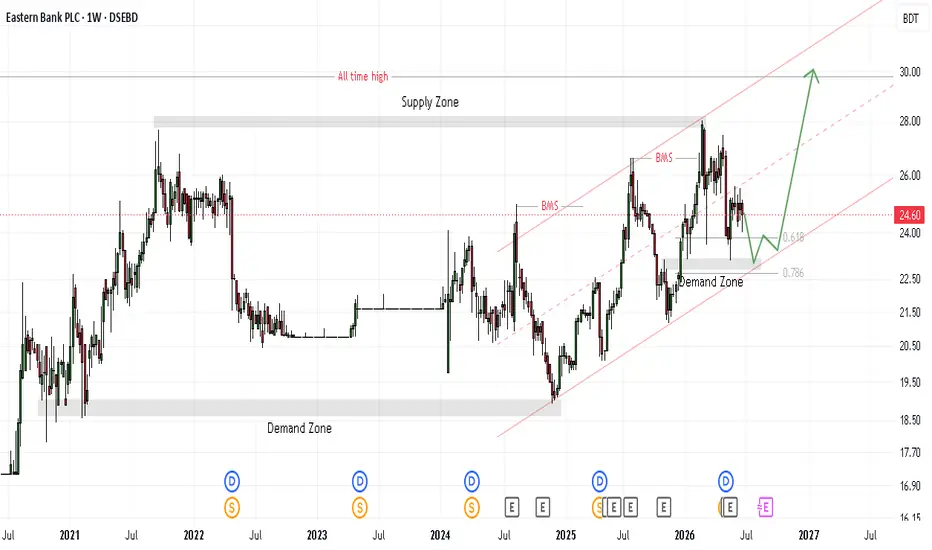
EBL OutlookTwo BMS (Break of Market Structure) events are marked:
First BMS — occurred around late 2023 / early 2024, where price broke above a prior swing high, confirming the uptrend.
Second BMS — occurred more recently (likely 2025-2026), another breakout to higher highs, reinforcing bullish momentum.
Price Action & Events
Demand (D) and Supply (S) circles mark reactive price points where the stock reversed from these zones in the past.
Event (E) squares likely correspond to corporate actions (dividends
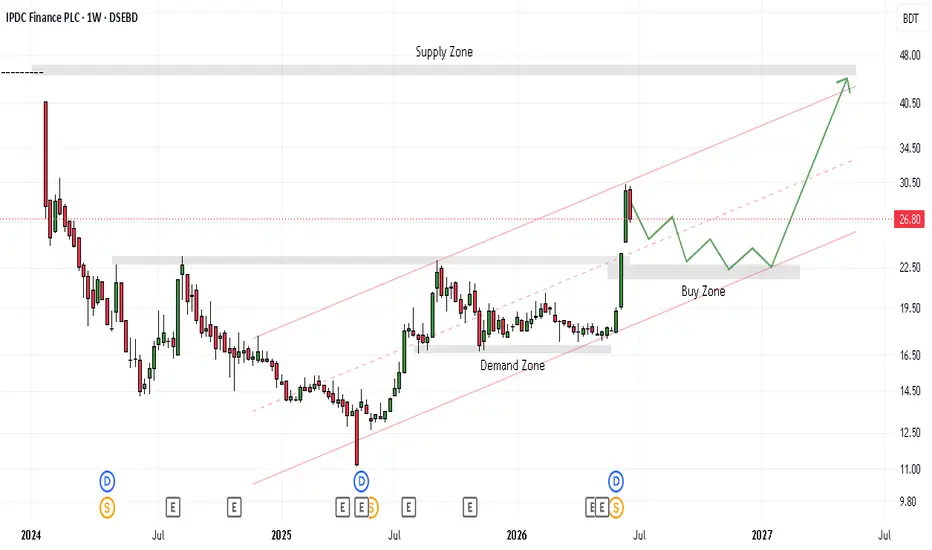
IPDCTrend Structure
Overall Trend: Strong bullish trend in a well-defined ascending channel (marked by two parallel red trendlines). Price has been systematically making higher highs and higher lows since early 2024.
Channel Midline: The dashed red line running through the center of the channel acts as dynamic support/resistance — the stock has been oscillating around it throughout the uptrend.
Key Zones
Table
Zone Price Range Significance
Demand Zone 17.00 – 19.00 BDT Strong historical buying area;
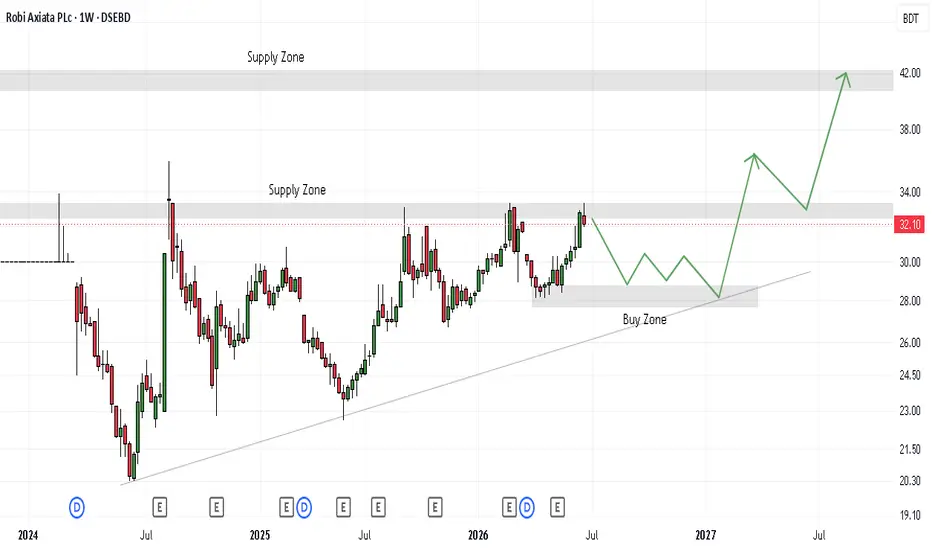
ROBICurrent Position & Outlook
The price is currently inside Supply Zone 1 (31–33 BDT), which presents a dilemma:
Bearish Near-Term Scenario (green arrow projection): The chart suggests the price may reject from this supply zone and decline back toward the Buy Zone (~28.50). This would mean:
A retest of the upward trendline support
A potential shakeout to accumulate more buyers
An ~11-13% downside from current levels
Long-Term Bullish Target: After a potential dip, the projection shows a strong ra
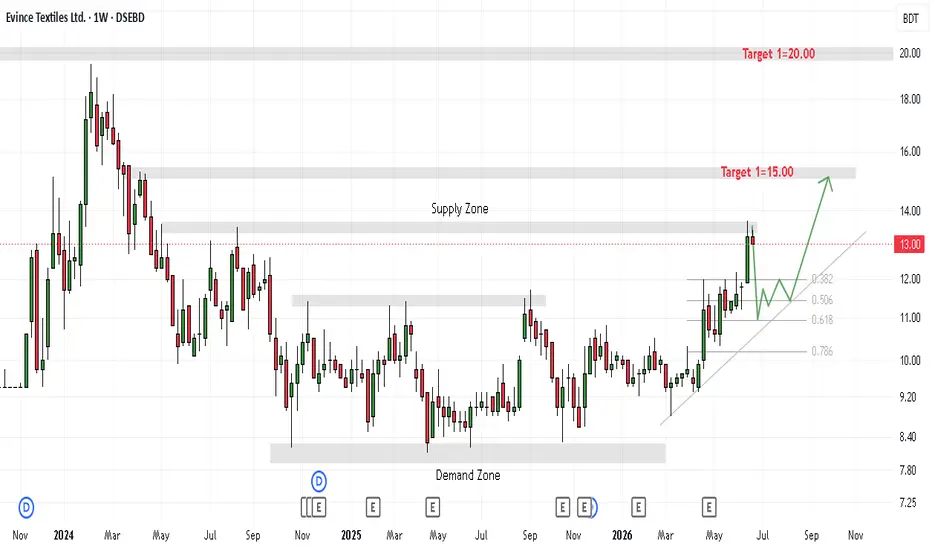
ETLTrend & Structure
Massive Downtrend (Early 2024 → early 2025): The stock fell from around 17 BDT down to the Demand Zone (~8.50) — a brutal decline of approximately 50%.
Bottoming & Accumulation (2025): Price oscillated within the Demand Zone, forming a base between 8–10 BDT. This is classic accumulation behavior.
Breakout & Uptrend (Late 2025 → Mid 2026): Price broke above the downward trend line (the diagonal line on the chart) and has been making higher highs and higher lows.
Current Price
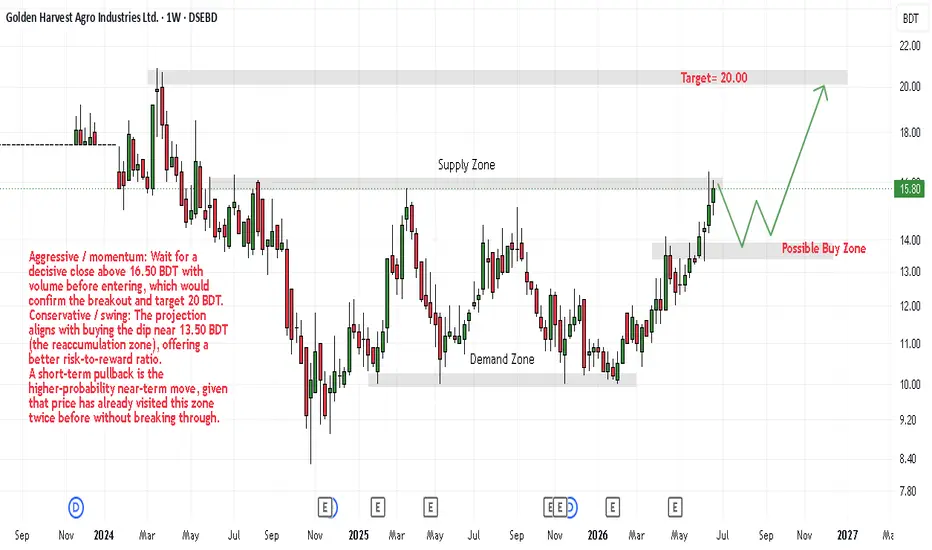
GHAILLate 2023 – Early 2024: The stock rallied sharply from the ~10 BDT demand zone up toward the ~16–16.50 BDT supply zone — a strong move of roughly 60%.
2024 – Mid-2025: The stock traded in a broad range, oscillating between those two levels, with multiple rejections at the 16 BDT area and bounces off the 10 BDT zone.
Late 2025 – Early 2026: Another strong rally broke through the 16 BDT resistance, surging toward the 20 BDT supply zone — but was rejected there, sending price back down.
Current (Ju
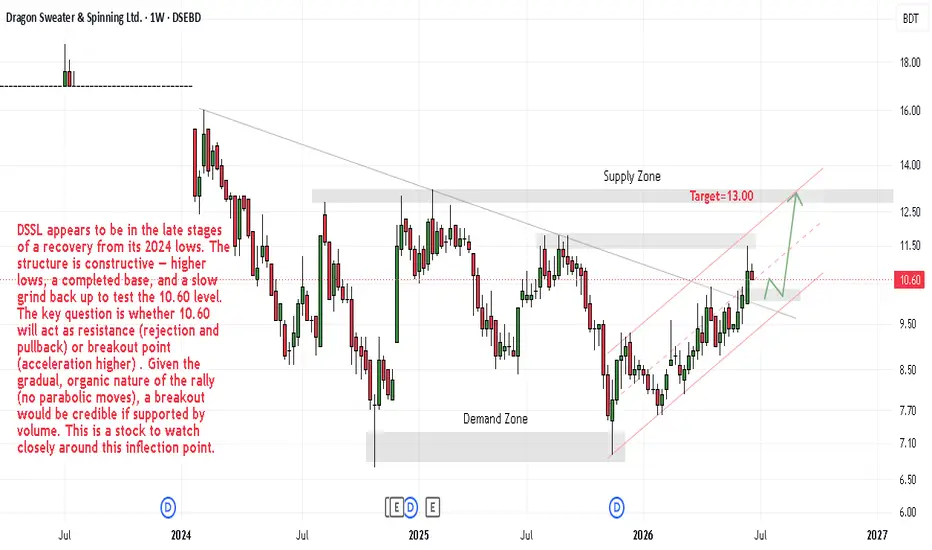
DSSLCurrent (June 2026)
Price sits at BDT 10.60, right on the red dashed line. The recent candles show an upward push to this level with some hesitation (smaller bodies near the line), suggesting it's being tested.
Technical Assessment
Macro Trend: The long-term structure is still downward from the 2023 highs, but the medium-term trend has turned bullish since late 2024.
Pattern: This resembles a rounded bottom / saucer pattern — a gradual transition from downtrend to accumulation to recovery.
Crit
MTB1. Overall Trend (Sep 2024 – Jun 2026) — The chart shows a clear ascending channel with higher highs and higher lows over the ~21-month period. The stock has moved from around 8.25 BDT to the current 12.90–13.00 zone.
2. Sharp Rally in Mid-2026 — A significant breakout occurred around June–July 2026, with price surging toward the 14.50 BDT level — near the 52-week high. This is marked by strong bullish candlesticks with above-average volume.
3. Recent Pullback — The most recent candles (late J
NCC BankCurrent Trend: The stock has been in a strong uptrend since early 2025, as indicated by the solid upward-sloping trendline. The recovery has taken NCCBANK from around 8.50 BDT to test the 20 BDT zone — a significant gain.
Current Situation — Correction Phase: The annotation notes that NCCBANK is currently undergoing a correction ("NCC correction face now"). The price appears to be pulling back from resistance in the 18-20 BDT range, which is typical after a sustained rally.
Support & Entry Zon
BD Thai foodKey Observations
Long-term Structure: The stock bottomed around late 2023–early 2024, then entered a prolonged accumulation/base-building phase through most of 2024–2025.
Breakout & Uptrend: A clear breakout occurred in late 2025, confirmed by rising volume and higher highs. Price has been in a steady uptrend since, with periodic pullbacks to rising support.
Current Position: Price is at 27.30, having pulled back from a recent high. The green trendline overlay suggests this pullback is nearing