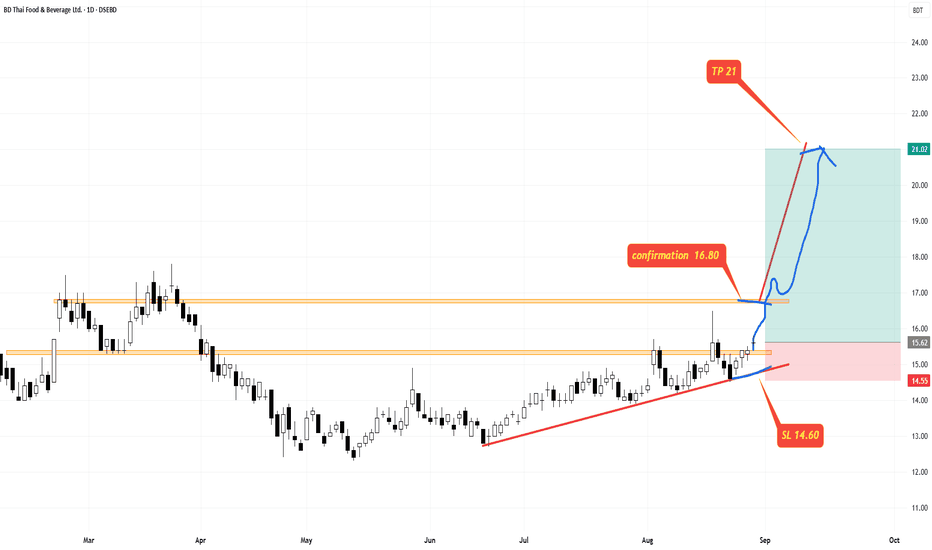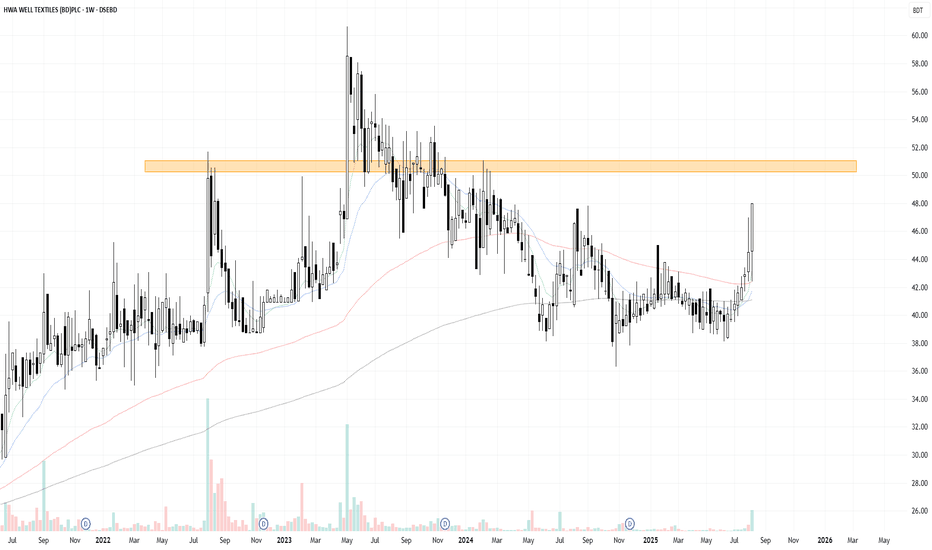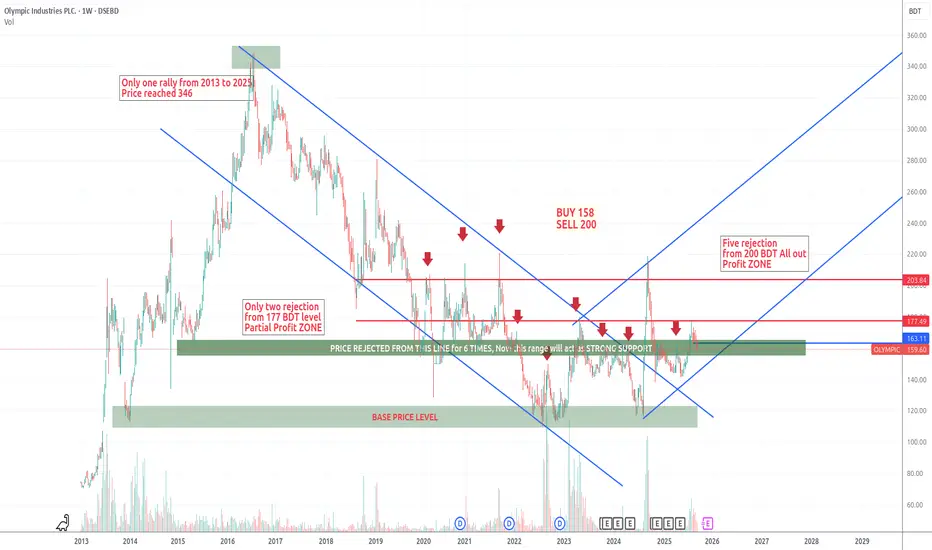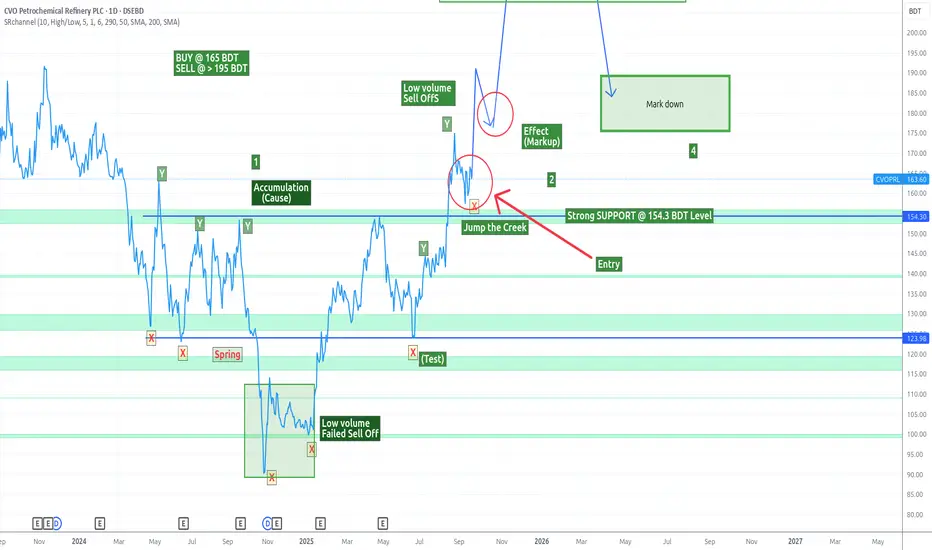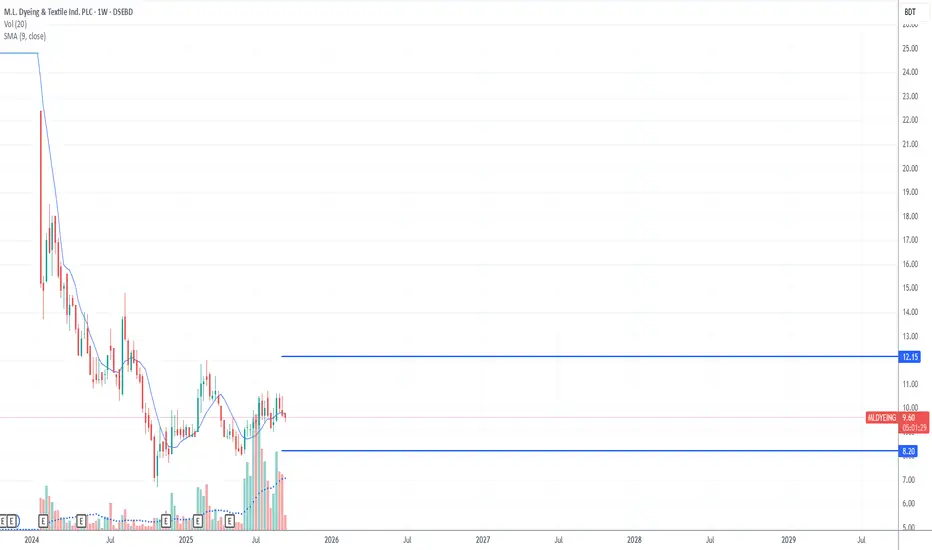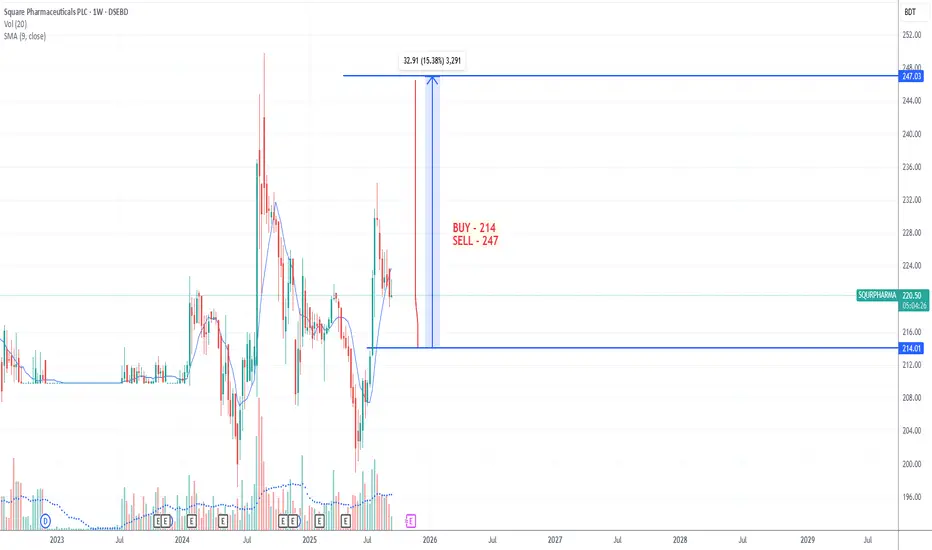
BDTHAIFOOD Share Analysis Structural resistance and volume are indicating strong potential for this stock.
Before entering the trade, always keep an eye on the confirmation area.
For proper risk management, set a clear stop loss and pre-define your take profit levels.
With the right entry, stop loss, and take profit strategy, this stock has the potential to deliver good returns.
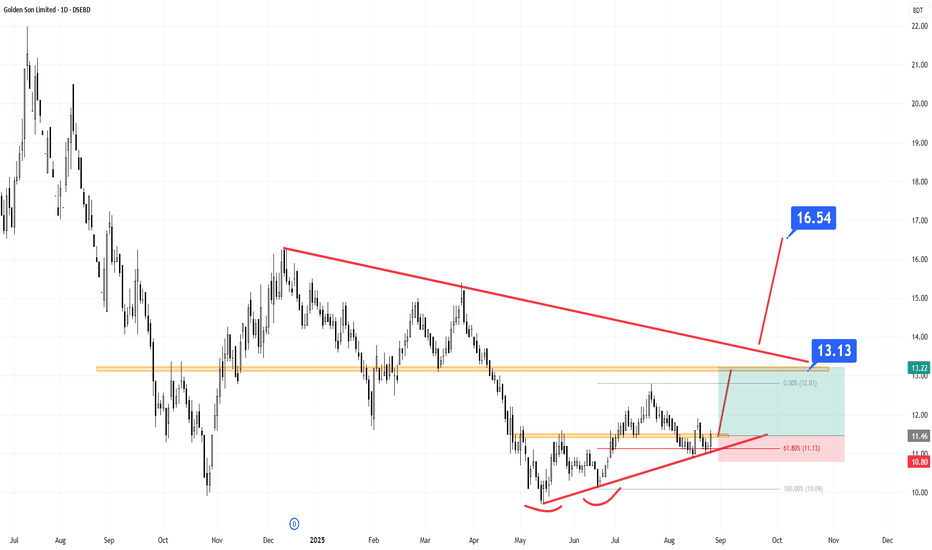
GOLDENSON Technical Analysis The stock has recently bounced from a short-term trendline. Not just once, but twice in the last 8 trading sessions, confirming the strength and reliability of this trendline.
On the daily chart, GOLDENSON has formed a double bottom pattern and is now trading at the neckline retest area. Technically, this is considered a strong Blind Buy Zone.
Moreover, the stock has retraced to the 61.8% Fibonacci retracement level of its last bullish wave, which is typically regarded as a strong reversal zone.
Targets:
Initial Target: ৳13.50 (approx. 15% upside potential)
Extended Target: ৳16.50+ (if a strong breakout occurs)
Summary:
Golden Son is currently at a powerful technical support zone. The confluence of the trendline support, double bottom formation, and Fibonacci retracement makes this a potential high-probability trade setup.
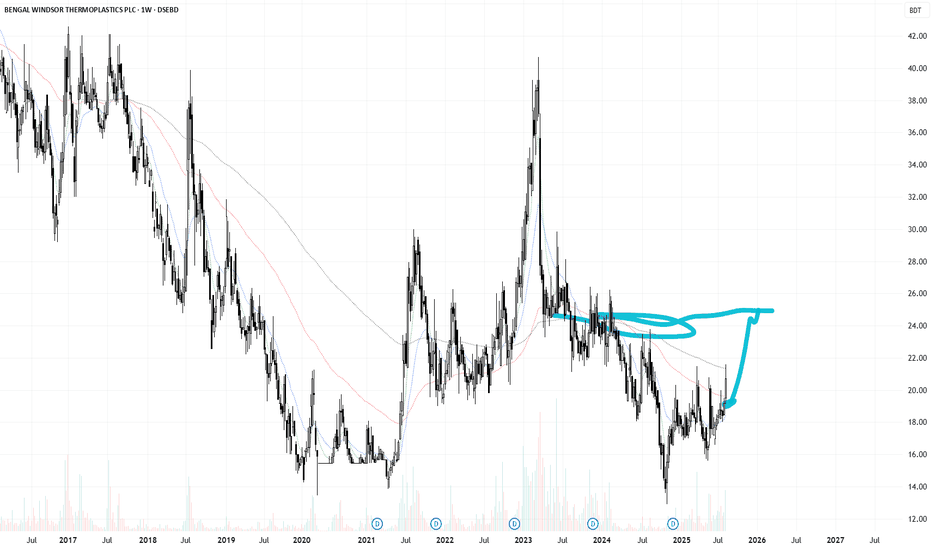
BD Stock Highlights — DSEX & 10 Key SharesIn this session, we provide a concise overview of some of the most discussed stocks in the Bangladesh market, including DSEX, HAKKANIPUL, DOMINAGE, BENGALWTL, ACMEPL, ORIONINFU, ANWARGALV, BSC, BSCPLC, SEAPEARL, and BXPHARMA. We highlight recent price action, market sentiment, and potential trading opportunities for short-term and medium-term investors. Perfect for traders who want quick insights before making their next move.
140 or Nothing! TAMIJTEX Faces Major Resistance AheadTAMIJTEX Technical Snapshot | Can it Break the 140 Supply Zone?
I’ve marked the key support, supply, and demand zones on the chart. Now the big question is — what’s next?
Can TAMIJTEX absorb the supply pressure at the 140 level?
The demand zone around 120 must hold at all costs — that’s a critical support.
If the price fails to break and sustain above 140, there’s not much room left for technical analysis — the setup weakens significantly. Sure, it may still reach 140, but that’s not enough — we need a breakout.
Remember, not every stock can be analyzed with the same lens. TAMIJTEX is one of those that demands a zone-by-zone approach.
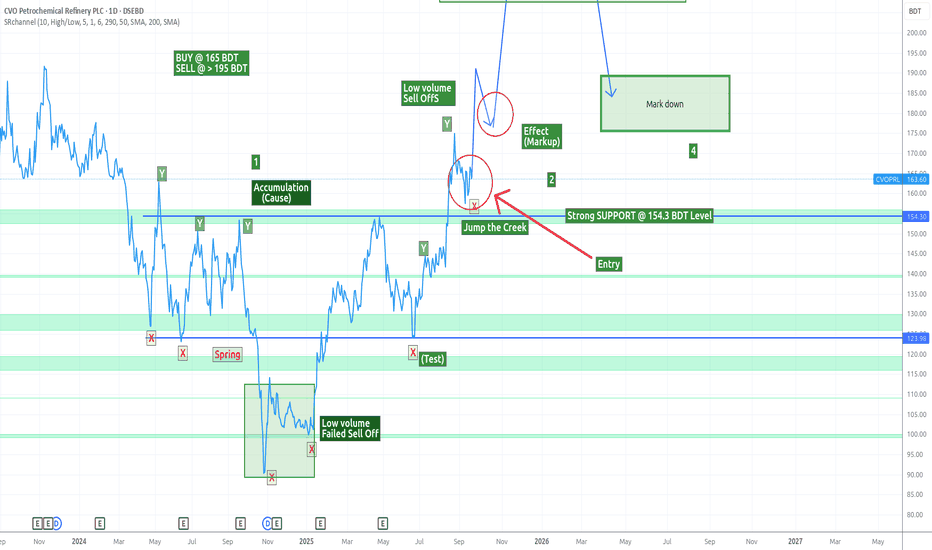
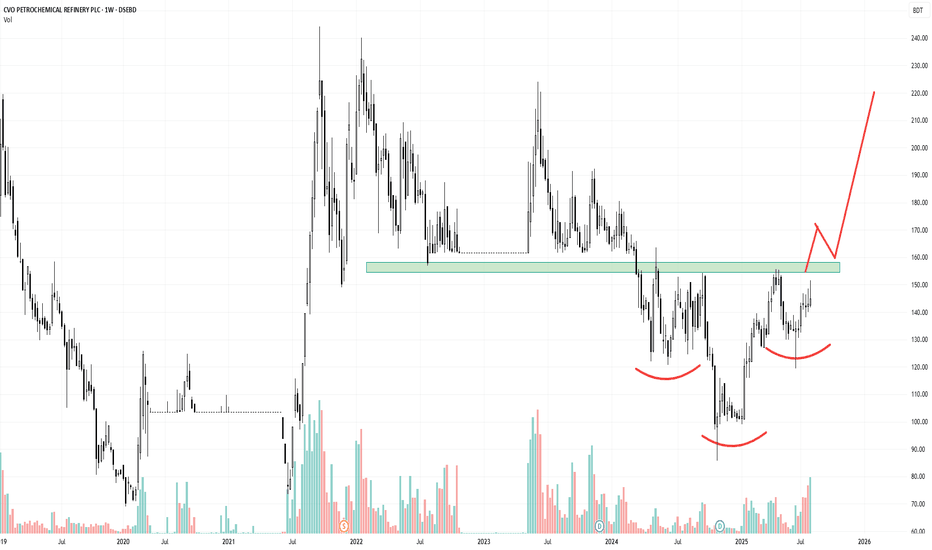
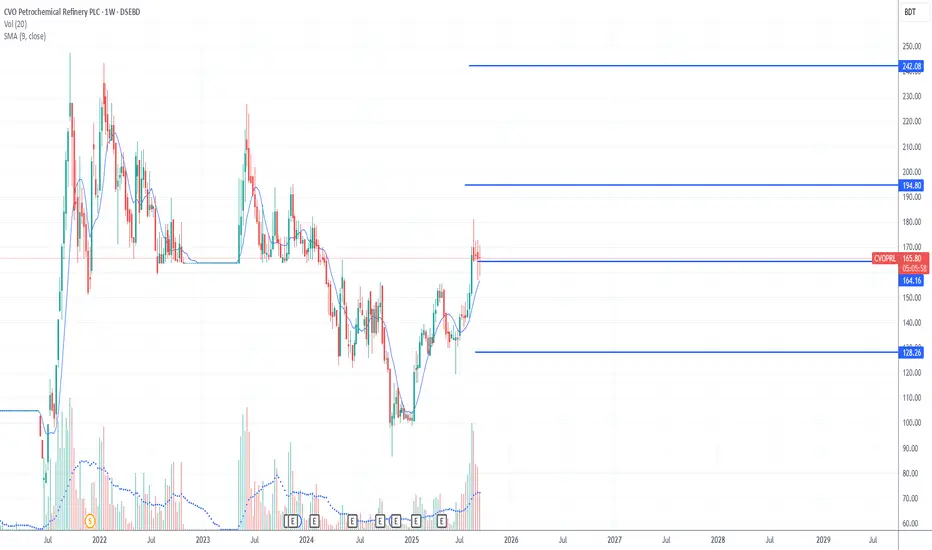
CVOPRL | Inverted Head & Shoulders Pattern – Bullish Reversal SeCurrent Chart Structure in CVOPRL:
CVOPRL has been in a downtrend, but recently it's showing signs of reversal.
The price has formed a clear inverted head and shoulders pattern.
The neckline resistance is currently being tested.
Volume behavior shows early accumulation, which supports a bullish bias.
Momentum indicators (RSI/MACD) are starting to turn positive, suggesting bullish divergence with price.
Trading Plan & Strategy:
Don’t jump in early. Wait for confirmation.
What to watch for:
Breakout above the neckline with convincing volume.
Retest of the neckline support (previous resistance).
Bullish candle formation (like a hammer, bullish engulfing) during retest.
Entry Point: After a breakout and successful retest confirmation.
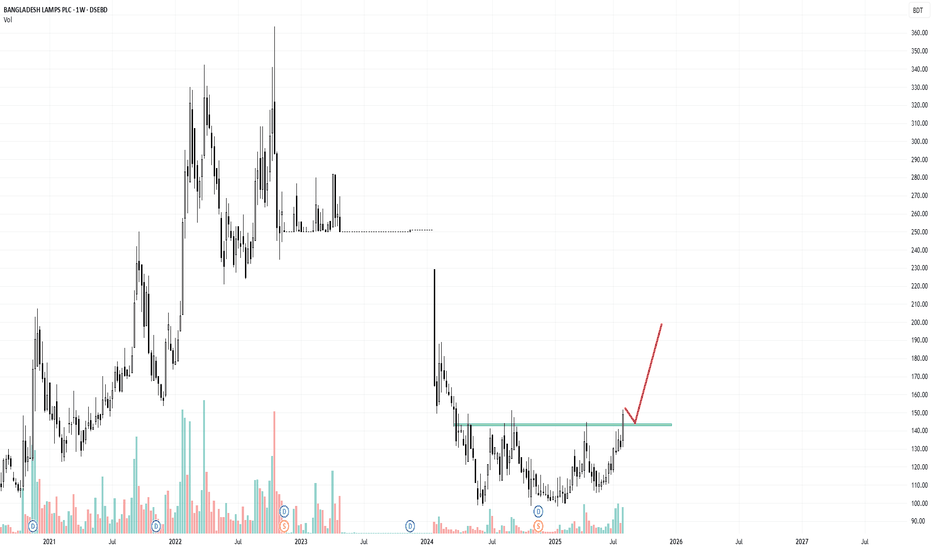
BDLAMPS Makes New High — Buy Pullback Towards Support Levels forRecent Price Action & Technical Set-Up
BDLAMPS has recently registered a new 52-week high, signaling steady bullish momentum. The current price stands around 150
Momentum & Volume
The surge is supported by elevated trading volume—well above the weekly average—indicating institutional participation and strong buying conviction.
Support & Pullback Strategy
A pullback to the breakout range between 140/145 may offer a favorable risk-reward entry point. This zone aligns with recent consolidation and could act as a reliable support area for re-entry.
RAHIMAFOOD: Buy on Dip Strategy – 135 Looks Like a Safer Entry Someone recently asked me about RAHIMAFOOD.
At such a high price level, there are certain technical limitations one must consider before buying:
# Where will the stop-loss be set?
# Is there any resistance overhead that could limit upside?
# Can we expect a mature move from this level?
My personal view:
It’s better to aim for a potential discounted entry. Around Tk. 135 looks like a reasonable discount zone.
If the price drops further, that would be even more favorable — a real golden opportunity.
However, if you have any confirmed insider news or strong conviction, you may choose to go ahead and disregard my cautious view.
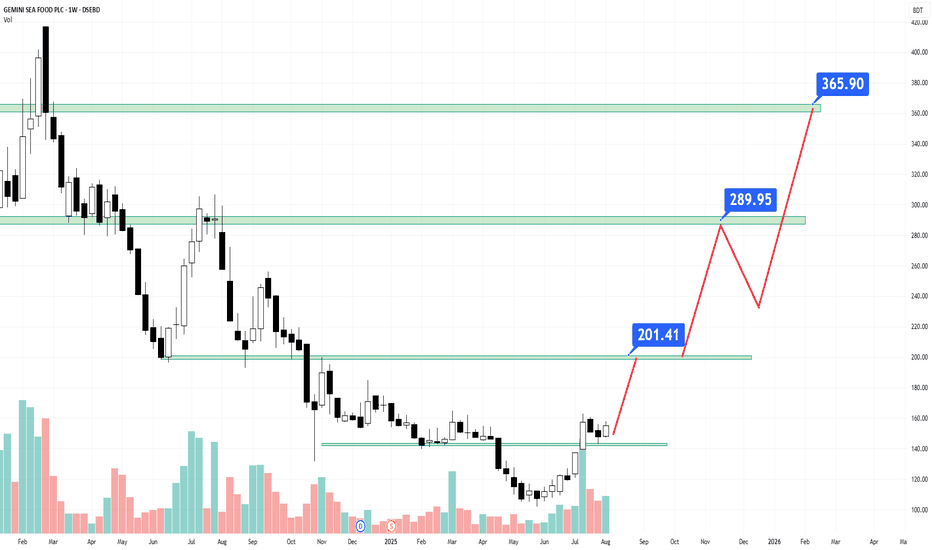
Massive Momentum in GEMINISEA – 163 is the Key for 300+ Move Technical Analysis: GEMINISEA (Weekly Outlook)
Trend: Bullish continuation with strong momentum
Volume: Significantly above average, supporting the breakout
Initial Resistance: Successfully breached at Tk. 140, confirming bullish intent
Key Breakout Level:
• Breakout candle high at Tk. 162.90
• A clean breakout above Tk. 163 on volume confirmation would validate the next leg of the rally
Potential Upside Targets (Based on Price Action & Fibonacci Extensions):
Target 1: Tk. 200
Target 2: Tk. 300
Target 3: Tk. 360 (long-term resistance zone)
Support Levels:
Immediate support: Tk. 140 (previous resistance turned support)
Stronger support zone: Tk. 125–130 (in case of pullback)
Conclusion:
GEMINISEA is showing strong bullish structure with high velocity and volume breakout. A sustained close above Tk. 163 may open up the path toward multi-level upside. Traders should watch for volume confirmation and manage risk accordingly.