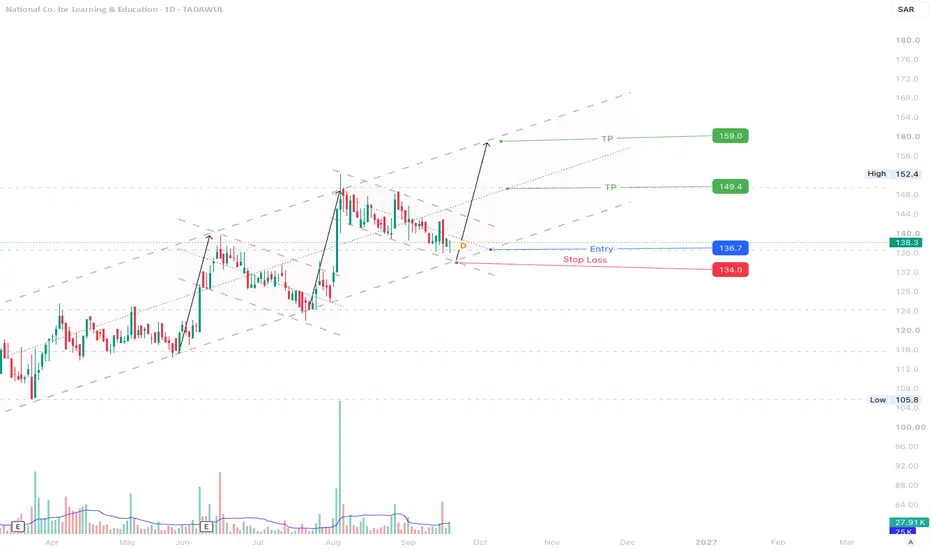
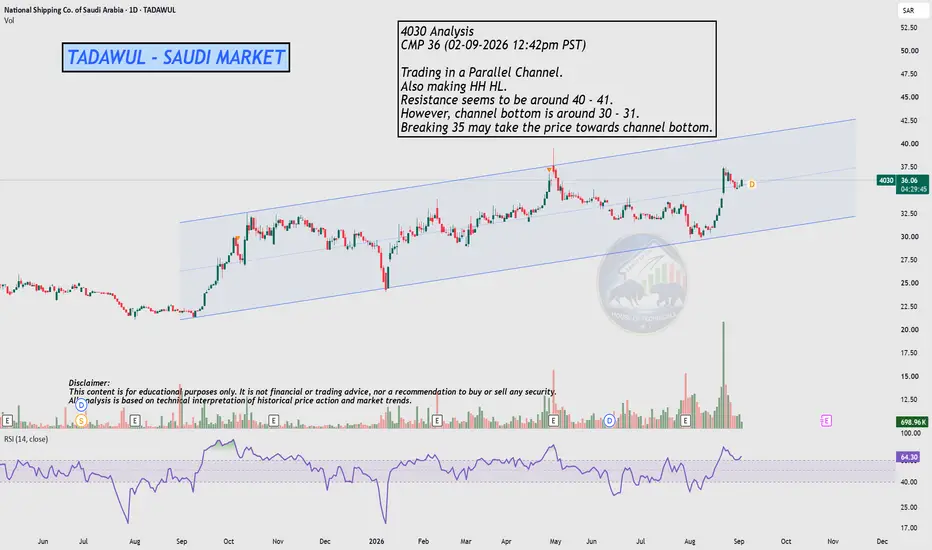
Potential Bounce From Channel SupportLooks like price is trying to hold the lower side of the rising channel around 136–138. Selling volume also doesn’t look too heavy for now, so if we start seeing a few good green candles with better volume, this area could give a bounce.
My idea would be around 136–138 entry, SL near 134, with 149.4 as the first target and around 159 if momentum continues. I’d personally wait for some confirmation instead of jumping in immediately.
Disclaimer:
The information provided is for educational and informational purposes only. It does not constitute financial or investment advice. Trading and investing in stocks involves risk, including the possible loss of capital. Any decisions to buy, sell, or hold securities are the sole responsibility of the reader. Past performance is not indicative of future results. Always do your own research and, if necessary, consult with a licensed financial advisor before making investment decisions.
Trying to Bounce From SupportPrice is still inside the downtrend channel, but this 40–40.5 area looks interesting after the recent bounce from around 36.60. If this level holds and buyers come back with better volume, we may see another push toward 43–44 and possibly the upper channel around 46–47.
Still needs confirmation, so I’d watch how price reacts here rather than rushing in.
Disclaimer:
The information provided is for educational and informational purposes only. It does not constitute financial or investment advice. Trading and investing in stocks involves risk, including the possible loss of capital. Any decisions to buy, sell, or hold securities are the sole responsibility of the reader. Past performance is not indicative of future results. Always do your own research and, if necessary, consult with a licensed financial advisor before making investment decisions.
Saudi National Bank — Bullish Buying Setup | Buyers EnteringSaudi National Bank is showing a developing buy-side setup after a period of downward price movement. The stock had been losing ground, but the latest price behaviour indicates that buying interest is beginning to emerge at the current structure.
The important development here is the change in participation. Selling pressure pushed the price toward lower levels, but buyers are now stepping into the market and attempting to absorb that weakness. This creates the possibility of a shift from the previous decline toward a broader recovery phase.
From a technical perspective, the setup is based on price structure, momentum behaviour, and the reaction of buyers around the current area. Rather than treating the previous decline as the complete story, the focus is on identifying whether the newly emerging demand can establish a stronger bullish sequence.
SNB is listed on the Saudi Exchange under ticker 1180 and belongs to the Banks sector.
The current setup therefore focuses on a potential transition: the market moved lower, selling activity dominated the earlier phase, and buyers are now beginning to challenge that downside pressure.
If this shift develops further, price could begin forming higher levels and open the path toward a stronger recovery. The key factor remains the ability of buyers to maintain control and convert the current reaction into sustained upside momentum.
📊 Technical Roadmap
Previous phase: Downward movement 📉
Current development: Buyers entering 🟢
Structure: Potential bullish transition
Bias: Buy-side
Objective: Higher levels / recovery
The idea is not based on simply buying because price has fallen. The focus is on the structural change taking place now — sellers pushed the market lower, but buyers are beginning to respond.
🔍 Setup Overview
- Instrument: Saudi National Bank
- Ticker: 1180
- Market: Saudi Exchange / Tadawul
- Sector: Banks
- Direction: Bullish / Buy
- Current condition: Buyers entering after a decline
- Technical focus: Structure, momentum and price behaviour
- Scenario: Potential recovery toward higher levels
The chart is now at an interesting transition point. The previous decline created weakness, but the appearance of fresh buying interest changes the character of the setup.
Sellers created the decline. Buyers are now attempting to create the recovery.
The next phase of price action will determine whether this emerging buying interest develops into a sustained bullish move, but the current structure provides a clear buy-side scenario to monitor.
Saudi Aramco — Bullish Buying SetupSaudi Aramco is currently presenting a constructive buy-side setup, with the price structure showing conditions that can support a potential upward continuation.
The analysis is focused on the behaviour of price, market structure and the signals generated through the trading methodology. Rather than reacting to individual candles, the broader objective is to identify whether buyers are gaining enough influence to drive the next meaningful expansion.
From a technical perspective, the current setup is positioned toward the upside. If buying pressure continues to strengthen and the existing structure remains supportive, Saudi Aramco could progress toward higher levels.
📊 Setup Overview
- Instrument: Saudi Aramco
- Market: Saudi Arabia 🇸🇦
- Tadawul Symbol: 2222
- Bias: Bullish 📈
- Direction: Buy
- Focus: Upside continuation
- Structure: Constructive
- Momentum: Buyers gaining influence
Saudi Aramco trades on the Saudi Exchange under symbol 2222 and is classified within the Energy sector.
The current buy-side thesis is primarily technical, while the company's underlying scale provides an important fundamental backdrop. Aramco describes itself as one of the world's largest integrated energy and chemicals companies. Its latest investor materials report H1 2026 adjusted net income of SAR 251.9 billion and total hydrocarbon production of 11 million barrels of oil equivalent per day.
🔥 Bullish Structure
The key element of this setup is the developing relationship between price structure and buying pressure.
If buyers continue to defend the current formation and maintain upward momentum, the market could transition into a stronger bullish phase. Short-term fluctuations may occur along the way, but the broader scenario remains focused on higher prices while the underlying conditions continue to support the buy-side view.
The methodology is designed to assess the complete market environment rather than depend on one isolated technical level. This allows the setup to remain focused on the broader directional opportunity while price continues to develop.
🌍 Fundamental Backdrop
Aramco's latest company disclosures also highlight its integrated upstream and downstream operations, alongside continued investment across energy, chemicals and adjacent growth businesses. Its 2025 annual report reported $104.7 billion in adjusted net income and $85.4 billion in free cash flow for the year.
These fundamentals do not determine the short-term price path by themselves, but they provide useful context around the company behind the technical setup.
🚀 Market Roadmap
The current scenario can be summarised as:
Constructive structure → Buyers strengthen → Momentum expands → Upside continuation → Higher levels in focus.
The key is to allow the market to confirm the strength of the move rather than forcing an outcome. As long as the bullish structure remains intact, the buy-side scenario remains the primary focus.
Saudi Aramco. Buyers in focus. Bullish structure developing. Upside ahead. 🎯📈🔥
Downtrend Channel – Breakout or Buy Near Support?The stock is still moving inside a downtrend channel and right now it is trading near the top of the channel.
There are 2 possible setups I’m watching:
Scenario 1:
If price breaks above the channel, I would prefer to wait for a retest instead of chasing the breakout. If the old resistance holds as support, that could be a good area to consider buying.
Scenario 2:
If price gets rejected from the top and continues moving down inside the channel, I’ll watch the lower side of the channel for a possible entry. If price reaches the bottom and manages to hold that support with some bullish reaction, it could give another buying opportunity.
For now, I think it’s better to wait and see which scenario plays out rather than entering in the middle.
ELM 7203First : sorry for writing in English because of my settings whic i try to change it and i couldnt ,,
I think Elm started a new positive counting after retracing 61% of the main upward wave , first target around 850 , after this level it may target its historical height and moves to the northern star .
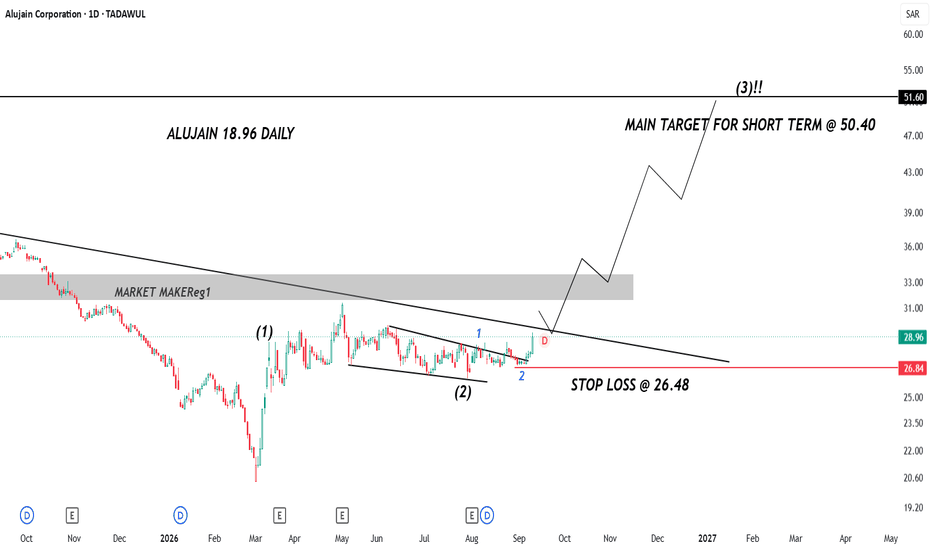
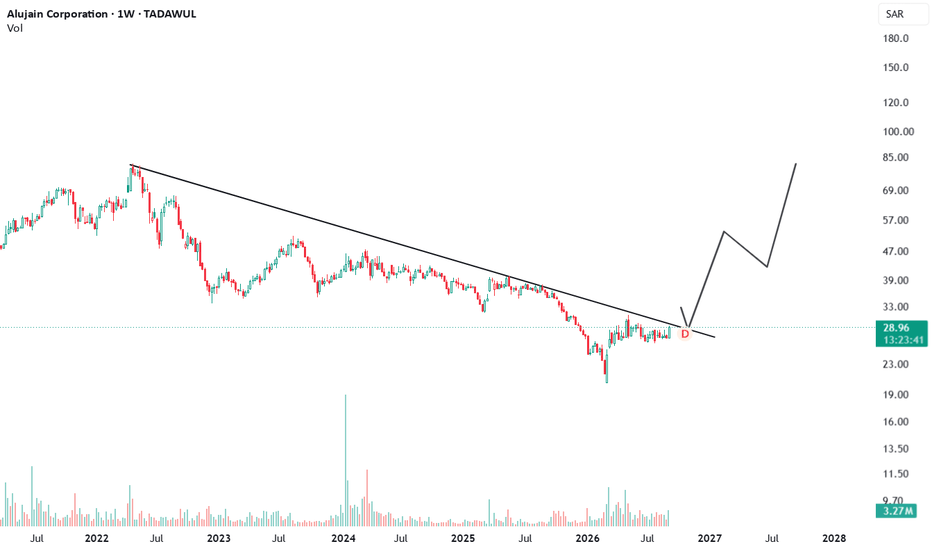
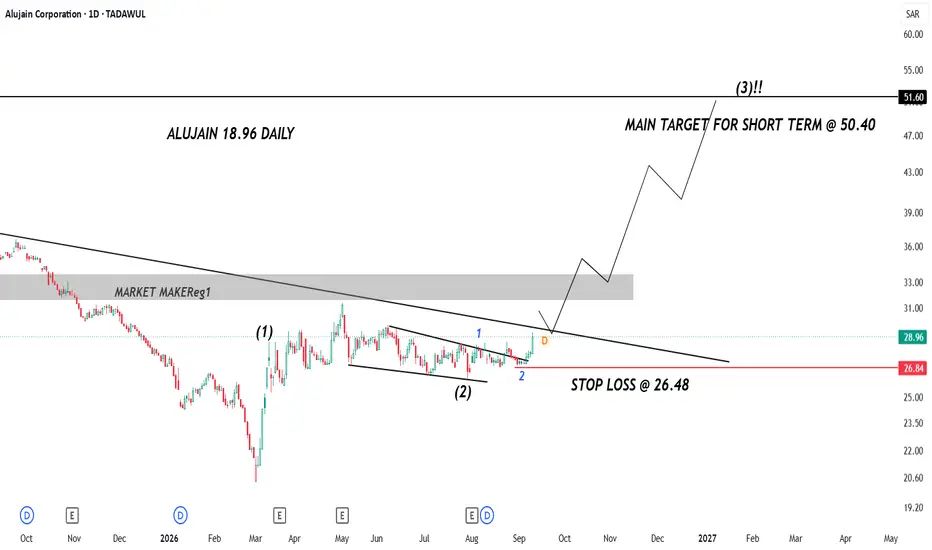
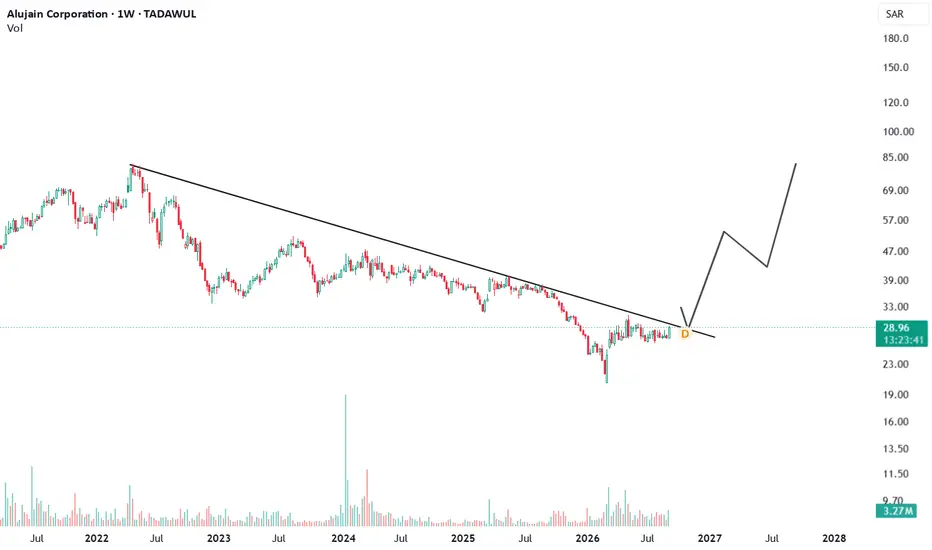
Alujain Corporation (2170) : Breakout Ahead for 40% Gain !TADAWUL:2170
🚀 Uptrend Consolidation — 31 Is the Key Breakout Level
Price remains in an uptrend, consolidating between 26–28 after a strong rally from 20 → 29.
Now the price is hovering near both trendline and horizontal resistance, making this a crucial decision zone.
🔑 Key Levels
26–28: Current consolidation/range
27: Potential support on any correction
30: Important sustain zone
31: Key breakout trigger
40–45: Potential upside targets
📈 Bullish Scenario
A breakout above 31, followed by sustained trading above 30, could signal continuation of the broader uptrend and open the path toward 40 → 45.
⚠️ Pullback Scenario
If price faces rejection from resistance, 27 becomes an important level to watch. Holding this area could provide the base for another attempt higher.
Overall bias: Bullish while the uptrend and 27 support remain intact.
🔥 Will 31 finally unlock the next leg toward 40–45?
Disclaimer: This analysis is for educational and informational purposes only and is not financial, investment, or trading advice. Technical targets are projections, not guarantees. Always conduct your own research (DYOR) and apply disciplined risk management.
#Tadawul #SaudiStockMarket #SaudiStocks #TASI #SaudiTrading #SaudiInvesting #SaudiInvestors #KSAStocks #SaudiEquities #RiyadhMarket #GCCMarkets #MiddleEastMarkets #TechnicalAnalysis #TradingView #PriceAction #Breakout #BreakoutTrading #RangeBreakout #MarketStructure #SwingTrading #MomentumTrading #TrendFollowing #StockAnalysis #TradingIdeas #BullishSetup #SupportAndResistance #RiskManagement #WiSHFundManagement
Naqi Water Company (2282) : Trendline Breakout is Required !TADAWUL:2282
🚀 Bulls Taking Control — 60–63 Is the Breakout Zone
The bulls appear to be gradually taking control, with price attempting to break out of the long-standing 48–60 range-bound zone.
The next few candles could be crucial.
📈 Bullish Scenario
If price successfully breaks and consolidates above 60–63, it would strengthen the breakout confirmation and could trigger a broader bullish rally toward:
🎯 74 → 79 → 90
The key here is sustaining above the breakout zone, rather than simply touching 60–63.
🔑 Key Levels
🛡️ 48: Range support
⚡ 60–63: Breakout & confirmation zone
🎯 74: First upside target
🔥 79 → 90: Further upside levels
For now, the overall bias remains bullish, provided price maintains the breakout structure and avoids falling back into the previous range.
48–60 was the battle zone. Can bulls turn 60–63 into the new support and unlock 74 → 79 → 90? 👀📈
⚠️ Financial Disclaimer
This analysis is for educational and informational purposes only and is not financial, investment, or trading advice. Technical targets are projections, not guarantees. Always conduct your own research (DYOR) and apply disciplined risk management.
#Tadawul #SaudiStockMarket #SaudiStocks #TASI #SaudiTrading #SaudiInvesting #SaudiInvestors #KSAStocks #SaudiEquities #RiyadhMarket #GCCMarkets #MiddleEastMarkets #TechnicalAnalysis #TradingView #PriceAction #Breakout #BreakoutTrading #RangeBreakout #MarketStructure #SwingTrading #MomentumTrading #TrendFollowing #StockAnalysis #TradingIdeas #BullishSetup #SupportAndResistance #RiskManagement #WiSHFundManagement
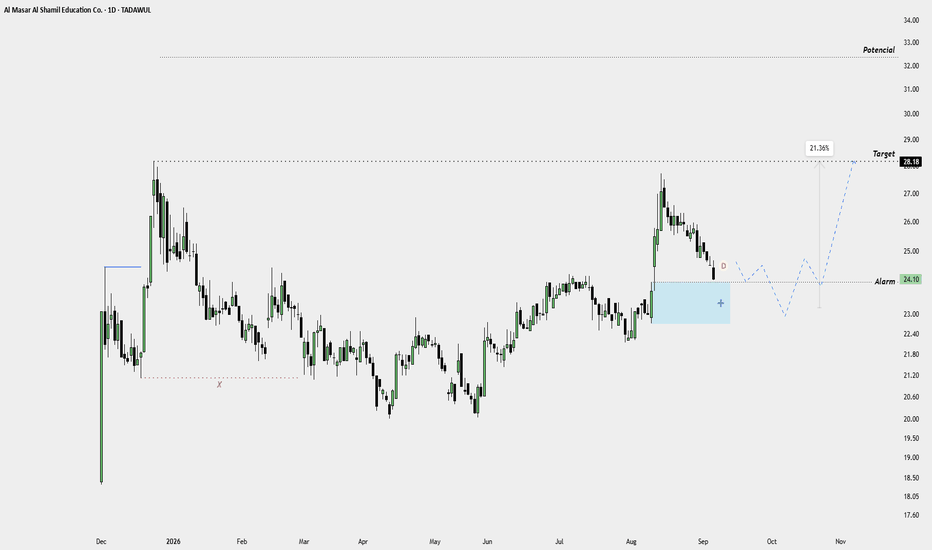
ALMASAR — Bullish Setup | Target 28.18 (6 September 2026)### **ALMASAR — Bullish Setup | Target 28.18 🎯**
Price is pulling back after a strong bullish expansion and is approaching the marked **demand/retracement zone**. As long as this area holds, the broader bullish structure remains intact.
**Key Level / Alert:** 24.10
**Primary Target:** 28.18 — around **21% upside**
**Extended Potential:** 32.00–32.50
The ideal scenario is a reaction from the highlighted demand zone, followed by renewed buying pressure and a move toward the previous high at **28.18**.
⚠️ The bullish idea becomes weaker if price loses the marked demand structure with a strong daily close below it.
**Wait for confirmation — don’t chase the move.**
#Tadawul #SaudiStocks #ALMASAR #TechnicalAnalysis #SwingTrading #BuyIdea
2001 Chemanol06-09-2026
Today closed @ 29.9
Created Gap opening on 19-08-2026
Gap filled already
Weekly TF showing Bullish divergence as well as double bottom
Very low risk entry can be made as close to 29 as possible
Stoploss @ 27
First Target 31
Second Target 32.9
Long term it has resistances @ 35, 40 & 45
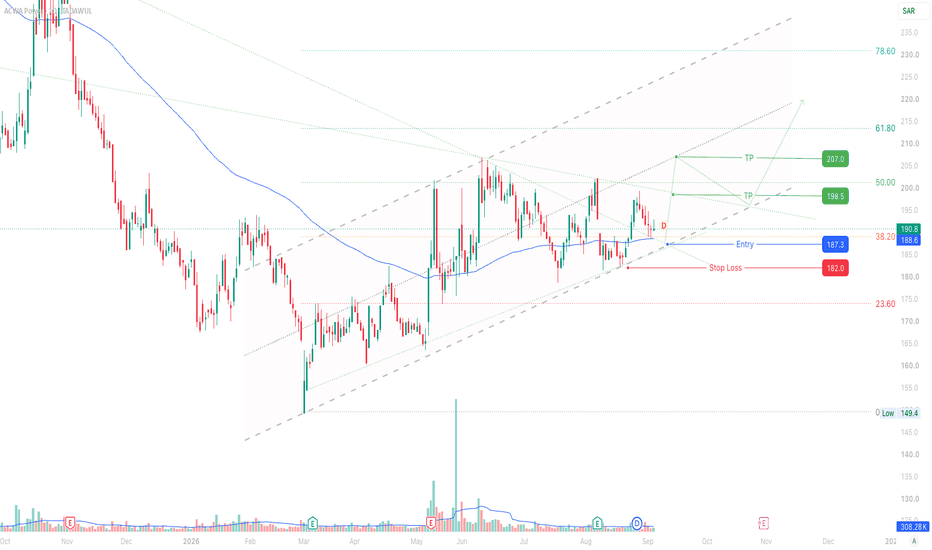
ACWA Power 2082 - Possible Bounce From Support ZoneSharing my view on ACWA Power 2082.
Price is moving inside a rising channel and currently sitting around an interesting support area near 187-190. We also have the 38.2% Fib around 189, the 200 EMA nearby, and what looks like old resistance possibly turning into support.
I’m watching 190 CMP, but a pullback closer to 187.3 would give a better entry in my opinion. SL around 182 below the recent swing low. First target around 198.5-201, and if price keeps the momentum, next area I’m watching is around 207.
Nothing guaranteed of course, just a setup I’m following. A strong break below 182 would invalidate the idea.
Disclaimer:
The information provided is for educational and informational purposes only. It does not constitute financial or investment advice. Trading and investing in stocks involves risk, including the possible loss of capital. Any decisions to buy, sell, or hold securities are the sole responsibility of the reader. Past performance is not indicative of future results. Always do your own research and, if necessary, consult with a licensed financial advisor before making investment decisions.
Obeikan Glass (4145) : Divergence for the Upside !TADAWUL:4145
🚀 Hidden Bullish Divergence — 30 → 32 → 36 in Focus
A hidden bullish divergence is supporting the current bullish structure, suggesting that buyers may still have control and that the upside momentum could continue.
If the trend remains intact, the next price zones to watch are:
🎯 30 → 32 → 36
📉 Buy-the-Dip Zone
If price enters a healthy correction, the 22 SAR area becomes an important level to monitor.
A controlled pullback toward 22, followed by a bullish reaction and formation of a Higher Low (HL), could provide an attractive buy-on-dip opportunity.
🔑 Key Levels
🚀 30: First upside target
🎯 32: Next resistance/target
🔥 36: Extended upside zone
🛡️ 22: Potential accumulation / reversal zone
As long as the broader bullish structure remains intact, a correction toward 22 could be an opportunity rather than a reason to panic.
Will hidden bullish divergence deliver the next move toward 30–32–36? 👀📈
⚠️ Financial Disclaimer
This analysis is for educational and informational purposes only and is not financial, investment, or trading advice. Technical targets are projections, not guarantees. Always conduct your own research (DYOR) and apply disciplined risk management.
#Tadawul #SaudiStockMarket #SaudiStocks #TASI #SaudiTrading #SaudiInvesting #SaudiInvestors #KSAStocks #SaudiEquities #RiyadhMarket #GCCMarkets #MiddleEastMarkets #TechnicalAnalysis #TradingView #PriceAction #HiddenBullishDivergence #BullishDivergence #MarketStructure #HigherLow #SwingTrading #MomentumTrading #TrendFollowing #SupportAndResistance #BuyTheDip #StockAnalysis #TradingIdeas #BullishSetup #RiskManagement #WiSHFundManagement
Saudi Automotive Services (4050) : Reversal in Progress !!TADAWUL:4050
🚀 Bulls Taking Control? 45 SAR Is the Key Level to Watch
The stock is currently approaching a minor resistance zone, with 44–45 SAR acting as the immediate hurdle.
A decisive breakout above 45 could unlock the next move toward:
🎯 49–50 SAR
But the real momentum shift comes if price can sustain above the 50–52 zone.
📈 Bullish Roadmap
44–45 → 49–50 → 58 → 62 → 65
A sustained move above 50–52 would clear the path toward the higher targets and strengthen the bullish market structure.
🔍 Why the Setup Looks Interesting
The daily bullish divergence around 38 was a clear early warning that selling momentum was weakening.
Since then, price has recovered roughly 13%. More importantly, even after the subsequent correction, sellers failed to push price below 41.
That inability to make a new low suggests buyers are gradually taking control.
🔑 Levels to Watch
🛡️ 41: Recent defensive support
⚠️ 44–45: Immediate resistance / breakout trigger
🎯 49–50: First upside zone
🚀 50–52: Major confirmation zone
🔥 58–62–65: Further upside targets
Once 45 is decisively cleared and sustained, the setup becomes much more attractive for a continuation rally.
The question now is simple:
Will 45 break and turn resistance into support—or will sellers defend the zone again? 👀📈
⚠️ Financial Disclaimer
This analysis is for educational and informational purposes only and is not financial, investment, or trading advice. Technical targets are projections, not guarantees. Always conduct your own research (DYOR) and apply disciplined risk management.
#Tadawul #SaudiStockMarket #SaudiStocks #TASI #SaudiTrading #SaudiInvesting #SaudiInvestors #KSAStocks #SaudiEquities #RiyadhMarket #GCCMarkets #MiddleEastMarkets #TechnicalAnalysis #TradingView #PriceAction #BullishDivergence #Breakout #BreakoutTrading #MarketStructure #SupportAndResistance #SwingTrading #MomentumTrading #TrendFollowing #StockAnalysis #TradingIdeas #BullishSetup #RiskManagement #WiSHFundManagement
Saudi Arabia Refineries (2030) : Bulls Taking Control ?TADAWUL:2030
🚀 0.886 Fibonacci Reversal + Bullish Wedge — Is Another Major Rally Brewing?
The weekly chart is presenting an interesting long-term reversal setup.
Price has rebounded from the 0.886 Fibonacci retracement level of the massive 26 → 200 swing—the same broader structure that previously delivered an extraordinary 10× rally in roughly 13 months.
Now, the stock is once again approaching a major decision point.
🔥 55–53 Is the Make-or-Break Zone
Price is currently testing weekly trendline resistance.
A weekly close and sustained move above the 55–53 zone would strengthen the bullish structure and could open the path toward:
🎯 63 — First upside objective
If buyers successfully sustain momentum above this zone, the next major target comes into focus:
🚀 98
📈 Bullish Confluences
Several technical signals are aligning:
✅ Reversal from 0.886 Fibonacci
✅ Weekly bullish divergence
✅ Falling wedge formation
✅ Price approaching long-term trendline breakout
✅ Previous history of explosive upside from deep Fibonacci support
The combination suggests that bulls may be gradually taking control, but the weekly trendline breakout still needs confirmation.
🛡️ Support Levels
If price fails to break the trendline immediately, the key downside levels to monitor are:
49 → 46
As long as these support levels hold and the weekly structure continues to improve, the broader reversal thesis remains intact.
🎯 Roadmap
46–49 Support → 53–55 Breakout Zone → 63 → 98
The extended upside may be 150-200 and even stretch to 300-350-400 price levels.
The setup is compelling—but 55 is the level where the chart needs to prove itself.
A sustained weekly breakout above 55 could turn this long-term reversal setup into a much bigger bullish move. 👀🚀
Do you think we're looking at the beginning of another major rally—or will the weekly trendline reject price once again?
⚠️ Financial Disclaimer
This analysis is for educational and informational purposes only and is not financial, investment, or trading advice. Technical targets are projections, not guarantees. Always conduct your own research (DYOR) and apply disciplined risk management.
#Tadawul #SaudiStockMarket #SaudiStocks #TASI #SaudiTrading #SaudiInvesting #SaudiInvestors #KSAStocks #SaudiEquities #RiyadhMarket #GCCMarkets #MiddleEastMarkets #TechnicalAnalysis #TradingView #PriceAction #Fibonacci #FibonacciRetracement #BullishDivergence #BullishWedge #TrendlineBreakout #Breakout #WeeklyChart #MarketStructure #SwingTrading #MomentumTrading #TrendFollowing #StockAnalysis #TradingIdeas #BullishSetup #RiskManagement #WiSHFundManagement
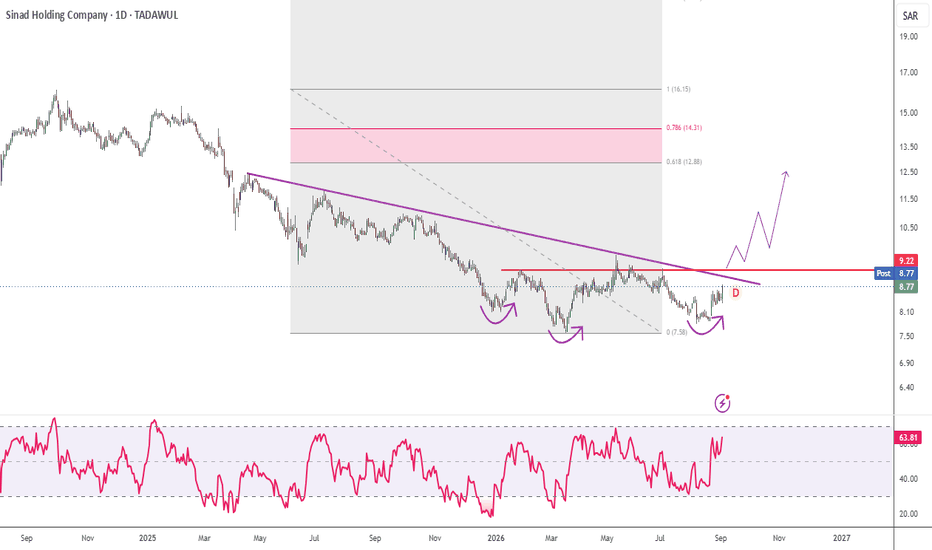
Sinad Holding (4080) : A Stock for Upside Gains !TADAWUL:4080
🚀 Reversal in Progress — 9.30 SAR Is the Breakout Trigger
The stock is showing an early reversal signal, with a decent bullish candle suggesting buyers are starting to regain control.
But the real confirmation is still ahead.
🔍 The Resistance Battle
Price is approaching a strong confluence resistance zone:
🔴 9.00: Trendline resistance
🔴 9.20: Horizontal resistance
🚀 9.30: Key breakout & confirmation level
The stock needs to break and sustain above 9.30 to confirm that the current reversal has enough strength for a further upside move.
⚠️ Rejection Scenario
If price fails to clear the 9.00–9.30 resistance zone, sellers could regain control and push the stock back toward:
🛡️ 8.62
A controlled pullback to this level could provide another opportunity to assess whether buyers are willing to step back in.
🎯 Bullish Scenario
A confirmed breakout above 9.30, preferably followed by a successful retest, could open the path toward:
🚀 13.00
That makes the current setup one to keep firmly on the watchlist rather than chase prematurely.
📊 Key Levels
🟢 8.62: Support / pullback zone
⚠️ 9.00: Trendline resistance
⚠️ 9.20: Horizontal resistance
🚀 9.30: Breakout confirmation
🎯 13.00: Potential upside target
For now, patience is key: let 9.30 break and hold before declaring the reversal confirmed. 👀📈
Breakout or rejection—which side are you watching?
#Tadawul #SaudiStockMarket #SaudiStocks #TASI #SaudiTrading #SaudiInvesting #SaudiInvestors #KSAStocks #SaudiEquities #RiyadhMarket #GCCMarkets #MiddleEastMarkets #TechnicalAnalysis #TradingView #PriceAction #TrendlineBreakout #Breakout #BuyTheDip #HigherHigh #HigherLow #HHHL #MarketStructure #FibonacciExtension #DoubleTop #SwingTrading #MomentumTrading #TrendFollowing #StockAnalysis #TradingIdeas #BullishSetup #RiskManagement #WiSHFundManagement
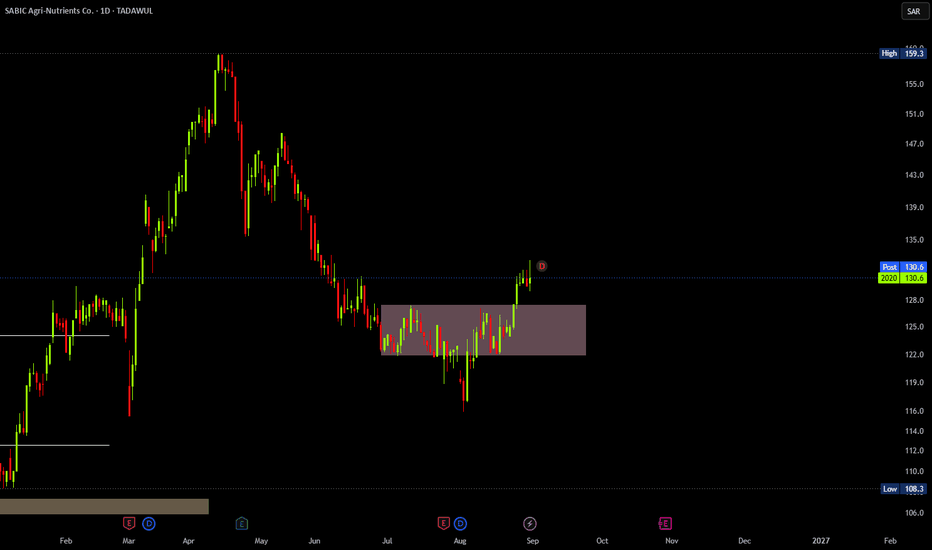
DON'T BUY 2020 YETContinuing our analysis on SABIC (2020), as I said on the 2010 analysis, this is one of the most requested analysis by my students.
Surely most of you have seen the small up movement it made after the 3 months bearish trend and want to ride it.
On the chart I marked a purple area that is considered as a consolidation level, the price just broke through it and we must wait for the price to give us a confirmation of the movement.
So now keep waiting for the confirmation to occur.
Follow for more!