Sedco Capital Reit Fund : From Deep Discount to Potential 14–16TADAWUL:4344
📈 From Deep Discount to Potential 14–16 Target? The Weekly Chart Tells an Interesting Story 🔥
The weekly chart suggests that price may have completed a major accumulation and recovery phase after rebounding from a deep discounted Fibonacci retracement zone of the previous bullish swing from 4.14 to 11.00.
🔍 The Price Structure
After the initial bullish move, price retraced within a descending parallel channel, eventually forming a significant swing low near 5.91 in November 2025.
Since that low, price has demonstrated strong weekly bullish momentum and steadily recovered, despite the severe geopolitical conflict affecting the region during the first half of 2026.
This resilience is an important technical observation.
⚠️ Key Resistance: 8.10–8.25
Price is now approaching a significant resistance zone around 8.10–8.25, which aligns with the 0.5 Fibonacci retracement level.
At this stage, the market may need to cool off before continuing higher.
This could happen through:
🔹 Sideways consolidation
🔹 A controlled technical correction
🔹 A retest of previous breakout levels
🎯 Two Critical Correction Zones
If price experiences a pullback, two areas stand out:
📍 7.13 — Parallel Channel Breakout Retest
A retest of the previous descending channel breakout could provide an important support test.
📍 6.80 — 0.618 Fibonacci Retracement Zone
This area represents the deeper Fibonacci retracement level of the latest bullish swing and could act as a potential demand zone.
🚀 Breakout Strategy
For new positions, chasing price at the current market price may carry a relatively higher risk due to the nearby resistance zone.
A confirmed breakout above 8.25, preferably followed by a successful retest and support confirmation, could provide a more favorable risk-reward entry for momentum traders.
📊 Potential Upside Targets
If the bullish structure remains intact:
🎯 Initial upside target: Around 12.00
This is where the projected AB=CD harmonic pattern could reach completion.
🔭 Extended target zone: 14.00–16.00
A Reverse Fibonacci Extension projection suggests the possibility of a larger measured move toward this region.
🧠 My View
The broader weekly market structure remains bullish, but price is now entering a major technical decision zone.
The key question is:
Will price break above 8.25 and accelerate higher, or will the market first consolidate and retest lower support levels before the next major move?
For me, 8.25 remains the key trigger level, while 7.13 and 6.80 are the important correction and accumulation zones to monitor.
Do you think this is a breakout setup—or does price need one more correction before the next leg higher? 👀
Share your view below. ⬇️
🔖 Hashtags
#Tadawul #SaudiStocks #SaudiStockMarket #TASI #SaudiInvesting #SaudiTrading #SaudiInvestors #TadawulStocks #SaudiMarket #KSAStocks #RiyadhMarket #GCCMarkets #MiddleEastMarkets #StockMarket #Investing #Trading #TechnicalAnalysis #PriceAction #Breakout #SwingTrading #MarketOutlook #StockAnalysis #TradingIdeas #Bullish #Bearish #ChartAnalysis #TradingView #WiSHFundManagement
Americana : Is a Breakout Around the Corner ?TADAWUL:6015
📈 5-Week Consolidation: Is a Breakout Around the Corner? 🚀
After spending nearly five weeks consolidating around the 2.00 level, price continues to hold within a tight range, with the recent swing high forming near 2.09.
This prolonged consolidation is becoming increasingly interesting from a price action and technical analysis perspective.
🔍 Key Technical Structure
🔹 Trendline support remains intact, suggesting buyers are still defending the underlying structure.
🔹 Price is also sustaining above the 2.03 resistance zone. If this level continues to hold as support, it could signal a potential resistance-to-support flip and increase the probability of an upside breakout.
🔹 After several weeks of sideways price action, a confirmed breakout could trigger a strong momentum expansion.
🎯 Potential Upside Targets
If price confirms a bullish breakout and maintains its position above the key resistance zone:
📌 Immediate upside target: 2.50–2.70
📌 Extended Fibonacci target: 3.20–3.50
📌 Key reference: 0.618 Fibonacci retracement/extension zone
⚠️ Setup Invalidation
The bullish thesis would be invalidated if price breaks decisively below the rising trendline support.
In that scenario, the consolidation structure could fail and price may potentially retrace toward the 1.75 support zone.
📊 My View
The market appears to be coiling after an extended period of consolidation.
As long as trendline support remains intact and price sustains above 2.03, the technical structure continues to favor a potential bullish breakout.
A confirmed breakout above the recent 2.09 swing high could provide the momentum needed for the next leg higher.
Is this consolidation preparing for a breakout, or will the trendline eventually fail? 👀
Share your view below. ⬇️
🔖 Hashtags
#TechnicalAnalysis #TradingView #PriceAction #Breakout #BreakoutTrading #BullishSetup #BullishTrend #SwingTrading #MarketStructure #Trendline #SupportAndResistance #ResistanceBreakout #Fibonacci #FibonacciRetracement #PriceTarget #MomentumTrading #ChartAnalysis #TradingIdeas #TradeSetup #StockMarket #Investing #TechnicalTrader #TrendFollowing #TradingStrategy #MarketOutlook #Bullish #WiSHFundManagement
The chart of Nadhi Medical Company (TADAWUL: 4164) The chart of Nadhi Medical Company (TADAWUL: 4164) clearly shows a falling channel pattern — a series of lower highs and lower lows bounded by two parallel descending trendlines. This structure typically signals a controlled downtrend that can eventually lead to a bullish reversal once price breaks above the upper boundary.
Here’s a structured technical breakdown:
📉 Falling Channel Analysis
Upper trendline (resistance): Around 103–106 SAR, aligning with the purple moving average (103.6 SAR).
Lower trendline (support): Near 88–90 SAR, where the current price (90.35 SAR) is hovering.
Channel slope: Moderate, suggesting a steady decline rather than panic selling.
🔍 Momentum Indicators
RSI: ~29.97 — deep in oversold territory.
RSI MA: ~40.31 — still trending down but flattening.
→ This divergence between price and RSI hints at weakening bearish momentum.
📈 Reversal Zone Projection
Based on the confluence of support and momentum:
Potential reversal level: 88–92 SAR
This zone coincides with the lower channel boundary and oversold RSI.
A confirmed weekly close above 94 SAR would strengthen the bullish reversal signal.
Upside targets after breakout:
First resistance: 103–106 SAR (channel top + MA).
Secondary target: 118–120 SAR (previous consolidation zone).
learning purposeshare your thought and identify the errors in chart. it is observed that 7204 is in down trend for long and it is obvious. it will clear give indication to learners who wanted to you different indicators, and trying by the own to identify the trends and trying to identify Fibonacci golden ratio. this might help you.
Jarir at Weekly Breakout; What Next ??TADAWUL:4190
📈 Weekly Breakout Intact | Eyes on 30 July Results
The weekly chart continues to paint a bullish picture after a decisive breakout above the 17.00 resistance level. As long as the price holds above this breakout zone, the primary trend remains in favor of the bulls.
🔹 Current Technical Structure
✅ Weekly breakout above 17.00 confirmed.
✅ Long-term trend remains bullish.
📅 30 July 2026 earnings could be the next major price catalyst.
🔹 Recent Price Action
Price rallied toward 18.00.
Profit-taking emerged around 18.30, which is normal after a strong move.
A fresh wave of buying could push the stock toward the 19.00–20.00 zone.
🔹 What to Expect After Earnings?
Post-result volatility is common. A correction of 20–25% should not be viewed negatively if it occurs within the broader uptrend.
Key support to watch:
🟢 17.00 (Weekly breakout level)
🟢 16.00–15.50 (High-probability demand zone)
A successful retest of these levels could provide the foundation for the next leg higher.
🎯 Bullish Roadmap
If buyers defend the support zone, the next impulsive rally could extend toward the 1.618 Fibonacci Extension with the following upside objectives:
🎯 20.00
🎯 23.00
🎯 26.00
🎯 29.00
💡 Final Thoughts
The trend remains bullish until proven otherwise. Short-term volatility around earnings may create opportunities rather than signal a trend reversal. Patience and disciplined risk management remain key.
What are your targets after the earnings announcement? Share your view in the comments!
This analysis is for educational purposes only and should not be considered financial advice. Always conduct your own research before making investment decisions.
Saudi Arabian Oil Co. (2222)Technical Note: Let the market come to your zones and show its hand. Trade safe and manage your risk! Always wait for your own confirmations before entering the market.
Risk Disclaimer: This analysis is for educational purposes only and does not constitute financial advice. Always practice proper risk and position sizing. Stop Loss Must if you want to be a profitable Trader.
Saudi Chemical (2230) bounced from 61.8% Fibonacci levelSaudi Chemical has bounced from the 61.8% Fibonacci level (8.15), which also lines up with the 100 EMA and a rising trendline. This makes the area a strong support zone. Today's bounce came with higher trading volume, showing buyers are becoming more active. If price stays above 8.15, the next level to watch is 8.51, followed by the previous high at 8.98. A close below 8.15 would weaken the bullish setup.
Disclaimer:
The information provided is for educational and informational purposes only. It does not constitute financial or investment advice. Trading and investing in stocks involves risk, including the possible loss of capital. Any decisions to buy, sell, or hold securities are the sole responsibility of the reader. Past performance is not indicative of future results. Always do your own research and, if necessary, consult with a licensed financial advisor before making investment decisions.
Al Rajhi Bank: Facing Liquidity and Regional HeadwindsDespite reporting solid Q1 2026 results, with a 14% growth in net profit, several systemic and macroeconomic risk factors could exert pressure on the stock in the medium term. Prolonged instability linked to the Iranian conflict represents a material risk for the entire Saudi banking sector. If the conflict were to escalate, Fitch warns that asset quality, profitability, and bank liquidity could contract, forcing an increase in provisions for credit losses (impairment charges). The sector is facing a contraction in liquidity conditions, with loan-to-deposit ratios hitting record levels across the board. In a stress scenario, Al Rajhi Bank's liquidity position could be tested: estimates indicate that the liquidity coverage on deposits for Al Rajhi, Riyad Bank, and Bank Albilad could fall to critical levels (10% or less) in the event of significant outflows. Growing competition for deposit gathering is driving up the cost of funding. If interest rates remain "higher for longer," banks with a high reliance on certificates of deposit or subject to greater domestic competition would see their net interest margins (NIM) compressed. The massive adoption of fintech, instant payments, and digital banking in Saudi Arabia is "compressing" risk timelines. The need to constantly update Anti-Money Laundering (AML) frameworks and cybersecurity in a rapidly evolving environment entails increasing operational investments which, over time, could weigh on the cost-to-income ratio. Despite the positive Q1 2026 results, shares have shown immediate signs of weakness on the stock exchange, reflecting growing "market caution" rather than simple fundamental weakness. When a stock reacts negatively to positive news, it often signals that the market has already priced in optimistic growth scenarios, making the asset vulnerable to potential corrections should future expectations not be met.
Saudi Manpower Solutions – Bullish Continuation Setup | 14 July ### **Saudi Manpower Solutions – Bullish Continuation Setup | 14 July 2026**
Price is consolidating after a strong bullish expansion, showing that buyers are still holding control. The highlighted daily range can act as the base for the next move.
A clean breakout and hold above the range would confirm bullish continuation. A deeper sweep below the consolidation is also possible before price reverses higher. As long as the recent swing low remains protected, the main expectation is expansion toward the marked upside target.
Maharah Human Resources – Bullish Expansion Setup | 14 July 2026### **Maharah Human Resources – Bullish Expansion Setup | 14 July 2026**
Price has broken above the recent daily consolidation with clear bullish displacement. The pullback zone below the breakout can provide support if price retraces before continuing higher.
As long as the marked demand area remains protected, the bullish structure stays valid, with the next objective at the previous major high and the marked upside target. Patience is important—avoid chasing the breakout and wait for a clean retracement or continuation confirmation.
Bahri (4030): Strong FundamentalsAfter reviewing Bahri’s FY2025 results and Q1 2026 performance, I believe the company remains fundamentally strong despite the market’s cautious pricing.
Key Highlights
* Revenue continues to benefit from a resilient tanker market.
* EBITDA remains at healthy levels, reflecting strong operating performance.
* Net debt is manageable relative to cash generation.
* Free cash flow has improved significantly following the major fleet investment cycle.
* The balance sheet remains solid, giving the company flexibility for future growth and shareholder returns.
Valuation
At the current market price of SAR 32, Bahri appears to be trading below my estimated intrinsic value.
Estimated Fair Value (Base Case): SAR 40
* Bear Case: SAR 34
* Base Case: SAR 40
* Bull Case: SAR 47
This implies approximately 25% upside to my base-case valuation.
Accumulation Strategy
Rather than buying all at once, I prefer building a position gradually.
* Strong Buy Zone: SAR 28.6–30.0
* Accumulation Zone: SAR 30.0–32.0
* Hold Zone: SAR 32.0–35.0
If fundamentals continue to improve, I would reassess the valuation accordingly.
Investment Thesis
Bahri is a cyclical shipping company, so future performance will largely depend on freight rates and global oil transportation demand. However, with a diversified fleet, improving cash generation, and a stronger financial position, the company appears well positioned to benefit if market conditions remain supportive.
Alkhorayef Water & Power Technologies (2081) – Strong FundamentaAlkhorayef Water continues to deliver strong operational performance despite recent market weakness.
Fundamental Highlights
• Q1 2026 net profit increased 10.9% YoY, while EPS improved to SAR 1.84 versus SAR 1.66 in Q1 2025.
• FY2025 was another record year, with revenue reaching SAR 2.47B and net profit increasing to SAR 255.7M, reflecting consistent execution and long-term growth.
• During 2026, the company secured over SAR 1 billion in new operation & maintenance and infrastructure contracts. Most of these contracts span 30–60 months, providing strong earnings visibility and recurring cash flows.
• The company also continues to grow its Book Value Per Share, which increased from SAR 23.27 (Q1 2025) to SAR 28.04 (Q1 2026), while maintaining healthy profitability.
Technical View
The stock is approaching a major demand zone around SAR 100–105, where previous buying interest emerged.
Price action suggests the market is testing an important support area. A successful hold above this zone could trigger a recovery toward the SAR 130 resistance level.
Long-Term Outlook
If Alkhorayef continues executing projects efficiently, maintains its current profitability, and converts its growing contract pipeline into earnings, I believe the market could gradually re-rate the stock.
Potential price roadmap:
* Short-term target: SAR 130
* Medium-term target: SAR 150–175
* Long-term fair value: around SAR 220
* Bullish scenario (continued earnings growth and successful execution): SAR 240–260
These targets are based on continued earnings growth, strong ROE, expanding book value, recurring long-term contracts, and disciplined execution.
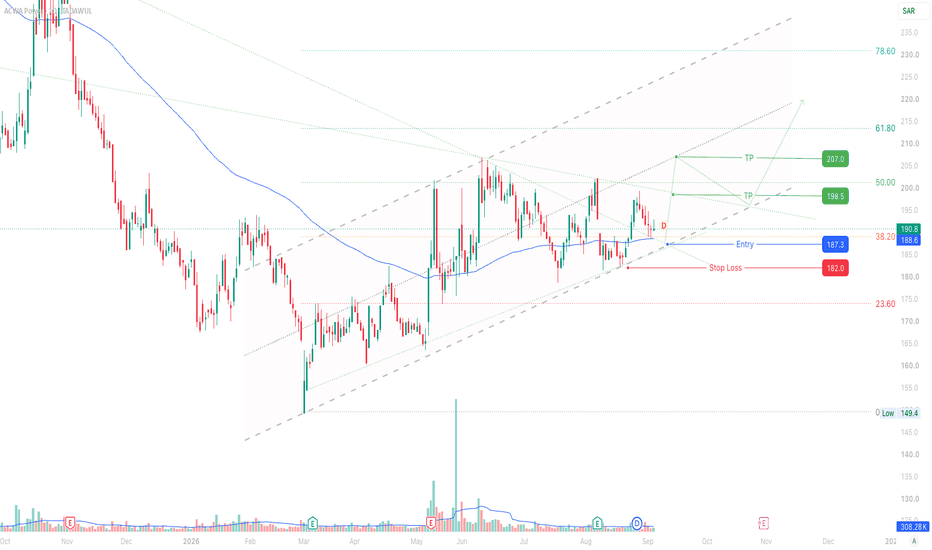
Rasan (8313): Watching a Confluence Support Zone Around 135Rasan is still trading inside an ascending channel even after the recent sharp drop.
Price is getting close to an interesting confluence zone around 135, where the lower boundary of the ascending channel, a previous support area, the 38.20% Fibonacci retracement. Increased chances of a positive reaction. I'm not in a hurry to enter, and would rather wait for a bullish candle. If the stock bounces from this zone, the next resistance level is 150 (Mid of the channel) and 160 as the top of the channel. A close below 124 would invalidate this setup.
Disclaimer:
The information provided is for educational and informational purposes only. It does not constitute financial or investment advice. Trading and investing in stocks involves risk, including the possible loss of capital. Any decisions to buy, sell, or hold securities are the sole responsibility of the reader. Past performance is not indicative of future results. Always do your own research and, if necessary, consult with a licensed financial advisor before making investment decisions.
EIC (1303) 61.8% Fibonacci Bounce Inside a Rising ChannelPrice has pulled back to the 61.8% Fibonacci level, which is seen as a previous support area.
It's also still trading inside the long term rising channel, so the trend looks positive for now, we could see a move towards the 16.70–17.00 area near the 78.6% Fibonacci level. Stop loss below 13.30 in case the support and channel fail. This looks like a decent swing setup if the bullish momentum continues.
Disclaimer:
The information provided is for educational and informational purposes only. It does not constitute financial or investment advice. Trading and investing in stocks involves risk, including the possible loss of capital. Any decisions to buy, sell, or hold securities are the sole responsibility of the reader. Past performance is not indicative of future results. Always do your own research and, if necessary, consult with a licensed financial advisor before making investment decisions.
2120 Saudi Advanced Industries July 05, 2026Saudi Advanced Industries Co. — Daily Bullish Dealing Range Idea | July 05, 2026
Symbol: Saudi Advanced Industries Co. — Tadawul
Timeframe: Daily
Chart Date: July 05, 2026
Saudi Advanced Industries Co. has swept the 2025 low and then reacted back above that level. This is an important sign because price first collected sell-side liquidity, then started showing bullish strength again.
Now the daily timeframe has formed a bullish dealing range. Price is holding above the recent reaction area, and the structure is starting to look cleaner for a possible upside continuation. The yearly Type 4 FVG is also sitting below as a higher-timeframe imbalance, which adds more importance to this whole area.
My main idea is simple:
after the 2025 low sweep, if the daily dealing range stays valid and price continues to hold above it, the next draw on liquidity can be the upper imbalance / value area shown on the chart.
I am not interested in chasing the candle emotionally. I would prefer to see price respect the daily dealing range, maybe give a small pullback, and then continue with bullish displacement.
For confirmation, I want to see:
Daily dealing range holds
Price stays above the swept low
No strong bearish breakdown back into the lower range
Bullish candles continue from the reaction area
Upside movement toward the marked value / liquidity zone
This setup is interesting because the market has already taken downside liquidity and is now showing early signs of bullish delivery. If buyers continue to defend this dealing range, price can move higher toward the marked target zone.
Patience pays. Wait for confirmation, not emotions.
Dar Al Arkan Real Estate Daily Bullish Continuation Idea July
Dar Al Arkan Real Estate Development Co. — Daily Bullish Continuation Idea | July 05, 2026
Symbol: Dar Al Arkan Real Estate Development Co. — Tadawul
Timeframe: Daily
Chart Date: July 05, 2026
Dar Al Arkan is showing a clean bullish idea on the daily timeframe. Price has already reacted from the monthly FVG area and is now holding above that zone, which shows buyers are still defending the higher-timeframe imbalance.
The market spent time consolidating after the first bullish move, and now price is trying to push higher again. This type of structure can become interesting if the daily candles continue to hold above the monthly FVG and start showing stronger bullish displacement.
My main idea is simple:
as long as price respects the monthly FVG and does not break back aggressively below the recent support area, the next draw on liquidity can be the marked upside target zone.
I am not interested in entering blindly. I would prefer to see price hold this area, create a clean bullish reaction, and then continue toward the higher targets.
For confirmation, I want to see:
Price holds above the monthly FVG
Daily structure remains bullish
No strong breakdown below the recent support
Bullish displacement from the current range
Continuation toward the marked upside target
This is a patience-based setup. The monthly FVG has already acted as an important area, and now the main question is whether buyers can continue defending it.
Patience pays. Wait for confirmation, not emotions.
4013 Dr. Sulaiman Al Habib Daily Bullish Recovery Idea | July 05Dr. Sulaiman Al Habib Medical Services Group Co. — Daily Bullish Recovery Idea | July 05, 2026
Symbol: Dr. Sulaiman Al Habib Medical Services Group Co. — Tadawul
Timeframe: Daily
Chart Date: July 05, 2026
Dr. Sulaiman Al Habib Medical Services Group is trading around a very interesting higher-timeframe area. Price has already reacted from the yearly FVG, suggesting that long-term buyers are defending this zone. Since then, the market has been building a base instead of making new lows, which is often an early sign of accumulation.
My main expectation is a gradual bullish recovery rather than an immediate explosive move. I want to see price continue respecting the yearly FVG, reclaim the nearby resistance area, and then target the previous monthly high. If buyers remain in control, the larger higher-timeframe target can come into focus later.
The roadmap I am watching is straightforward:
Hold above the yearly FVG support.
Continue building a bullish daily structure.
Break and hold above the nearby resistance zone.
Reclaim the previous monthly high.
Continue toward the higher-timeframe target if momentum remains strong.
I am not interested in chasing candles after a strong rally. The better opportunity comes from waiting for confirmation and allowing the market to prove that buyers are still in control.
This setup offers an attractive reward if the higher-timeframe support continues to hold, but patience is essential.
Patience pays. Let the market confirm the move before committing to a position.
2287 ENTAJ (TADAWUL) 25 june 2026**Trade Idea – ENTAJ (TADAWUL)**
**Bullish Setup**
I'm waiting for confirmation before entering this trade.
A **daily candle close above the blue resistance line** will confirm bullish strength and increase the probability of a continuation move.
**Plan:**
* ✅ Enter only after a **daily candle closes above the blue line**.
* 📈 First target: **29.42**
* 🚀 Final target: **38.32**
* ❌ No breakout, no trade.
**Patience pays. Let the market confirm before committing.**
almawarid manpower [2]reeting everyone...
in this chart i share my 2nd look in almawarid manpower company with ICT / SMC analysis self explanatory notes
we reached our targets the 3rd one almost there.
from now on we revaluate the company based on the next quarter financial announcement
best regards
Dar Al Arkan (4300): Mapping using the Fibonacci LevelsSimple Fibonacci setup I'm watching. Price is trying to hold above the 38.2% retracement since few days, and a successful hold could lead to a move toward higher Fibonacci levels towards 19.28 (50%), 20.38 (61.80%). Looking forward to seeing how it plays out.
Disclaimer:
The information provided is for educational and informational purposes only. It does not constitute financial or investment advice. Trading and investing in stocks involves risk, including the possible loss of capital. Any decisions to buy, sell, or hold securities are the sole responsibility of the reader. Past performance is not indicative of future results. Always do your own research and, if necessary, consult with a licensed financial advisor before making investment decisions.
Saudi Enaya (8311): Bullish Setup Still Intact?Stock is still moving inside an upward channel and is sitting near an important support area around SAR 10.90. If this level holds, there's a good chance it could move towards the targets at SAR 12.20, SAR 12.86, and eventually SAR 14.41. But if the price drops below SAR 9.44 and closes there, the bullish setup may no longer be valid.
Disclaimer:
The information provided is for educational and informational purposes only. It does not constitute financial or investment advice. Trading and investing in stocks involves risk, including the possible loss of capital. Any decisions to buy, sell, or hold securities are the sole responsibility of the reader. Past performance is not indicative of future results. Always do your own research and, if necessary, consult with a licensed financial advisor before making investment decisions.