4141A consolidation range, also known as a trading range, refers to a period in the financial markets when the price of an asset moves within a defined range, showing little overall direction. During consolidation, the price fluctuates between a well-defined upper resistance level and a lower support level. This phase occurs after a trend and typically precedes a breakout in either direction, signaling the continuation or reversal of the prior trend.
Characteristics of a Consolidation Range
1. **S
2001 reverse area to create a high trend?Hello everyone,
I would like to share my analysis of this stock, which I have been following since September 2022. The price is currently in a zone that has a high probability of initiating a countertrend and starting an upward movement. I see the downside target at 16.46.
Please note that the current time might not be the best for entry, but I decided to share this analysis for those interested in following this stock. I have included an explanation in Arabic on the chart that explains how to
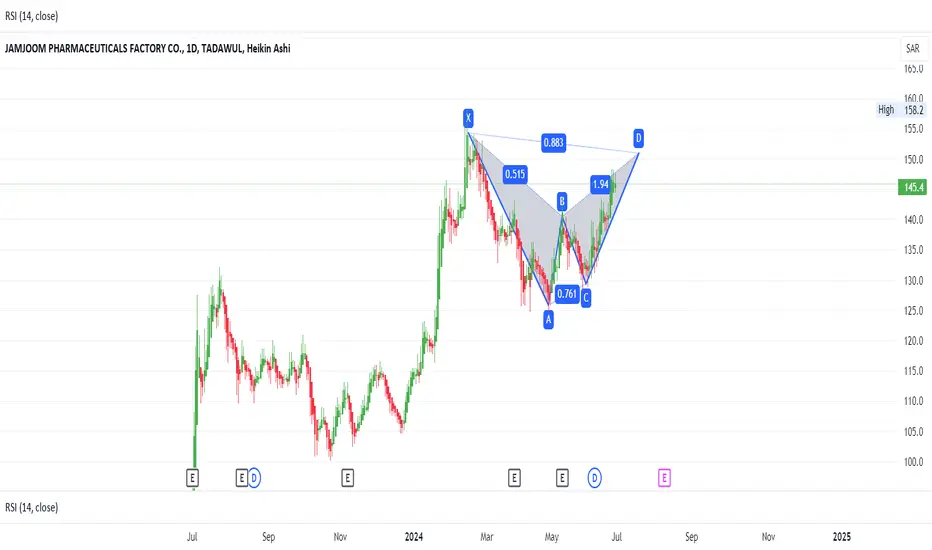
Jamjoom
A bearish butterfly is a specific chart pattern used in technical analysis within the realm of Harmonic Trading. This pattern helps traders identify potential reversal points in the price of an asset, typically indicating that the asset's price may reverse from an uptrend to a downtrend.
Key Features of the Bearish Butterfly Pattern
The bearish butterfly pattern consists of five points labeled X, A, B, C, and D. The pattern is formed by four distinct price swings, creating specific Fibonacci r
Bullish divergence in Saudi FisheriesA bullish divergence is observed in Saudi Fisheries in a daily timeframe. The current downtrend is expected to reverse into an uptrend due to divergence. Another important factor contributing to this is the price level being close to point D i.e. Potential Reversal Zone (PRZ) of the previously formed ABCD pattern. If the last LH is broken, then it will be a confirmation of the reversal and can be a good opportunity to take a long position.
The big move on February 2, 2025 for Saudi Aramco 2222By studying the chart of the Aramco stock, the following can be observed:
A green timeline was previously drawn on May 12, and there was an expectation of a reversal at that time.
However, the secondary was put forward, which formed pressure and a qualitative test on the stock, which led to the postponement of the reversal to the accumulation area until September 22.
There is an expectation of breaking the resistance level at 33 Saudi riyals with strong momentum by February 2, 2025, and God k
Sustaining 125 will lead it towards further upsideSustaining 125 will lead it towards further
upside. Immediate resistance levels can be
131 and then 137.
On the flip side, 110 - 111 may act as Immediate
Support levels on Weekly basis.
For a ABCD Pattern Trade, let it
Cross & Sustain 148 for a Target of 200.
DON'T BUY 2222I got questions from people if they can buy 2222 or no,
My answer is don't buy it, and if you have any position you're holding just close it since the stock is still pushing downwards and there's no indication now to buy.
You can notice on the volume that the sellin power is still high so there's no point of buying now.
For further question or suggestions for stocks to buy, don't hesitate to ask!