Almarai (2280) – Descending Channel BreakoutPrice has been moving inside a well-defined descending channel since the October high.
Recent candles show bullish momentum from the lower channel boundary, supported by increasing volume.
RSI rebounding from oversold (~30 → above 50) suggests momentum shift.
Last strong bullish candle signals potential trend reversal or corrective rally.
Potential Entry:
Daily close above 44.50 (channel resistance break)
Stop Loss:
42.90 (below recent swing low & channel support)
Take Profits:
TP1: 46.00 (minor resistance)
TP2: 48.20 (previous structure / VWAP zone)
TP3: 50.00 (major resistance & psychological level)
Disclaimer:
The information provided is for educational and informational purposes only. It does not constitute financial or investment advice. Trading and investing in stocks involves risk, including the possible loss of capital. Any decisions to buy, sell, or hold securities are the sole responsibility of the reader. Past performance is not indicative of future results. Always do your own research and, if necessary, consult with a licensed financial advisor before making investment decisions.
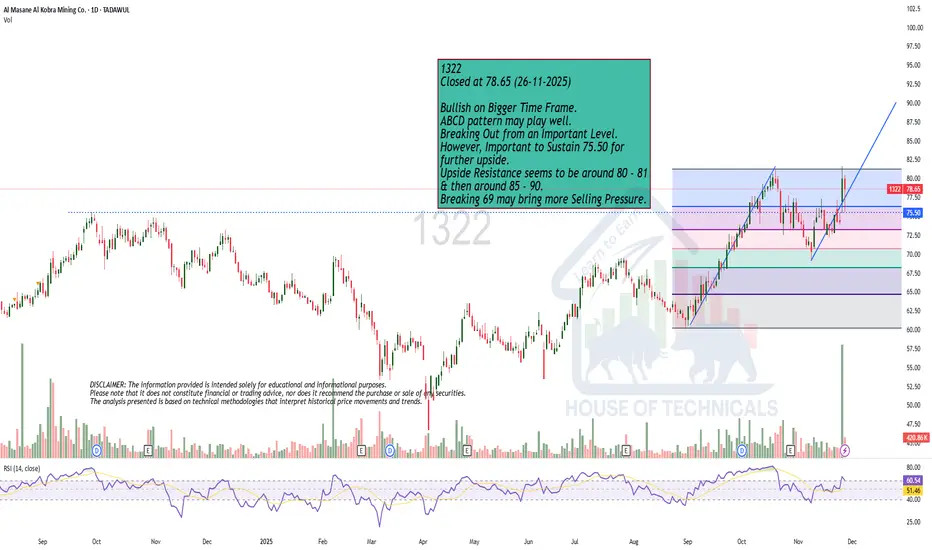
Bullish on Bigger Time Frame.1322
Closed at 78.65 (26-11-2025)
Bullish on Bigger Time Frame.
ABCD pattern may play well.
Breaking Out from an Important Level.
However, Important to Sustain 75.50 for
further upside.
Upside Resistance seems to be around 80 - 81
& then around 85 - 90.
Breaking 69 may bring more Selling Pressure.
Trade Plan Future Care Trading Co. (9544 | Tadawul) 25 Dec 2025Trade Plan – Future Care Trading Co. (9544 | Tadawul)
Bias: Bullish recovery from long-term support
Initial Entry: Buy from the marked Entry Zone near the range low.
Trade Management:
Target 1: Take full or partial profit at Target 1 to secure gains.
Second Entry (Re-Entry):
Wait for price to pull back into the Point of Interest (POI).
Enter again only after bullish confirmation from the POI.
This second entry confirms continuation toward higher levels.
Final Targets:
Primary Objective: Candle Range Theory high.
Extended Target: Upper Profit Taking zone if momentum remains strong.
Invalidation:
A weekly close below the range low invalidates the bullish setup.
Risk Management:
Reduce risk after Target 1 by locking profits.
Trail stop to breakeven on the re-entry position.
Core Idea:
Secure profits early, re-enter from a high-probability POI, and ride the move toward the higher candle-range targets.
Buy Plan Altharwah Albashariyah Co. (9606 | Tadawul) 25 Dec 2025Buy Plan – Altharwah Albashariyah Co. (9606 | Tadawul)
Bias: Bullish recovery
Entry: Buy from the marked Entry Zone near the protected low.
Confirmation: Weekly close holding above the protected low with bullish reaction.
Invalidation: Weekly close below the protected low.
Targets:
Target 1: Mid-range / first resistance
Target 2: Upper Profit Taking zone (prior high)
Risk Management: Partial profit at Target 1, hold remaining position for higher target.
Simple idea: Accumulate near support, protect the low, and aim for higher timeframe upside.
Buy Plan – Saudi Cable Co. (2110 | Tadawul) 25 Dec 2025Buy Plan – Saudi Cable Co. (2110 | Tadawul)
Bias: Bullish (long-term)
Entry: Buy from the marked Entry Zone after a strong bullish monthly close.
Confirmation: Price holds above the recent swing low and forms a higher low.
Invalidation: Monthly close below the last major low.
Targets:
Target 1: First marked Profit Take zone
Target 2: Higher Profit Take zone for long-term holding
Risk Management: Take partial profit at Target 1, move stop to breakeven, hold remaining position for higher targets.
Simple idea: Accumulate Saudi Cable Co. on strength from the entry zone and hold for higher timeframe upside.
Middle East Paper Co. (1202)Price is near long-term lower trendline support.
Daily RSI ~32 → oversold (potential bounce).
EMA20 and EMA50 are above price
If price breaks EMA20, bullish momentum may pick up.
Entry: Above 22.90 - 23.10 SAR
Take Profit Targets:
TP1: 24.00 SAR
TP2: 25.30 SAR
TP3: 26.50 SAR
Stop Loss @ 22.30 SAR
If the price closes below 22.30 the bottom trend line breaks and price may go down further.
Disclaimer:
The information provided is for educational and informational purposes only. It does not constitute financial or investment advice. Trading and investing in stocks involves risk, including the possible loss of capital. Any decisions to buy, sell, or hold securities are the sole responsibility of the reader. Past performance is not indicative of future results. Always do your own research and, if necessary, consult with a licensed financial advisor before making investment decisions.
Aramco: Rebound Near Key SupportI’m looking to buy the dip and ride the trend as long as the structure stays intact as the stock is oversold and ready to bounce!
My Findings:-
Price is reacting from a strong support area. Previous support Mar 2020. Buyers stepping in, and I’m expecting a bounce toward resistance.
Entry: Above breakout 24.15 SAR
Take Profit Targets:
TP1: 24.60 SAR (near immediate resistance)
TP2: 25.50 SAR (previous support area)
TP3: 26.10-26.50 SAR (higher resistance zone)
Stop Loss @ 22.90
Disclaimer:
The information provided is for educational and informational purposes only. It does not constitute financial or investment advice. Trading and investing in stocks involves risk, including the possible loss of capital. Any decisions to buy, sell, or hold securities are the sole responsibility of the reader. Past performance is not indicative of future results. Always do your own research and, if necessary, consult with a licensed financial advisor before making investment decisions.
SRMG 4210 – BUY TRADE SET-UP | 1-Hour | 21 DEC 2025 | TCASRMG 4210 – TECH BUY TRADE SET-UP | 1-H | 21 DEC 2025 | By The Chart Alchemist
SRMG 4210 was previously in a bearish trend but has now shown strong signs of upward reversal.
After reaching a low of SAR 137, which acted as a robust support level, the stock has established a third-entry long setup.
Price structure indicates accumulation and demand absorption, supporting a continuation move.
This setup presents a high-probability bullish scenario toward the projected target levels.
Arabian Drilling Company (2381) – BUY TRADE SET-UP | TCA|21 DEC
The stock was previously in a bearish trend before entering a well-defined accumulation phase.
This accumulation structure indicates absorption of supply and strengthening demand.
Price has now broken out of the accumulation range, confirming a shift in market character.
This breakout structure suggests readiness for a sustained upward move toward higher levels.
Saudi Aramco Base Oil Company (Luberef) (2223) – BY TCA|21DEC 25
The stock was previously in a sustained downtrend that ended with a clear selling climax and stopping action.
This was followed by a strong bullish reversal, confirming a change in market character.
After rallying to SAR 96.90, price entered a pullback phase and successfully formed a higher low.
This higher-low structure signals continuation of bullish momentum toward higher projected targets.
Saudi Arabian Mining Co.(1211) – TECH BUY TRADE SET-UP | 21 DECSaudi Arabian Mining Co. (1211) - BUY TRADE SET-UP | 21 DEC 2025 | By The Chart Alchemist
Previously, the stock was in a Wyckoff reaccumulation phase and successfully broke out, achieving its initial upside objectives.
Following the rally, price entered an A-B-C corrective structure, which now appears complete.
The corrective phase ended with a successful retest of the prior breakout zone, confirming structural strength.
This price behavior suggests renewed bullish momentum with potential continuation toward higher targets.
Beautiful Bullish Divergence. 2080
Closed at 88.40 (18-12-2025)
Beautiful Bullish Divergence.
However, 88 - 91 is an immediate resistance,
if this resistance is crossed with Good volumes,
99 - 100 can be touched easily.
Monthly Closing above 88 - 89 would be a positive sign.
On the flip side, 80 - 82 may act as important Support.
However, breaking 79 may bring more selling pressure
towards 65 - 70.
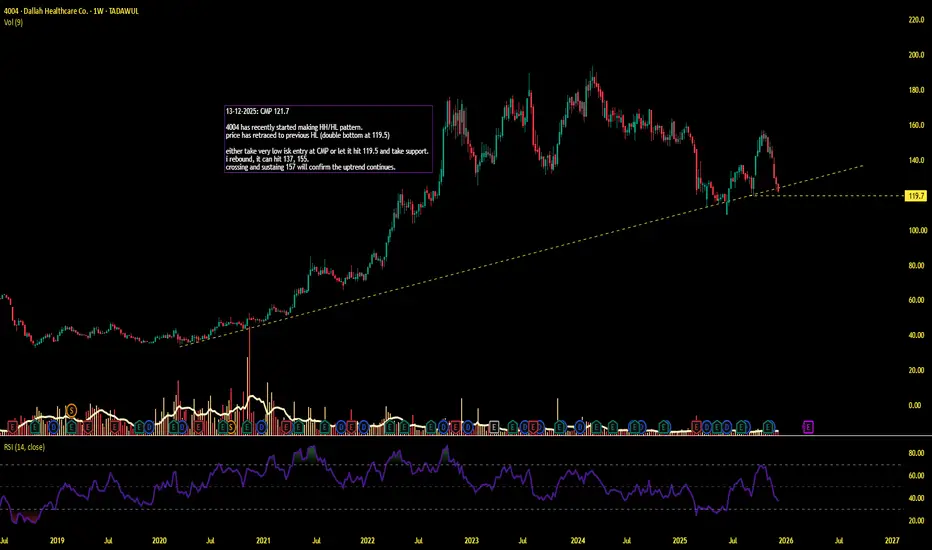
HH/HL Pattern13-12-2025: CMP 121.7
4004 has recently started making HH/HL pattern.
price has retraced to previous HL (double bottom at 119.5)
either take very low isk entry at CMP or let it hit 119.5 and take support.
rebound from here can take it to 137, 155.
crossing and sustaing 157 will confirm the uptrend continuation