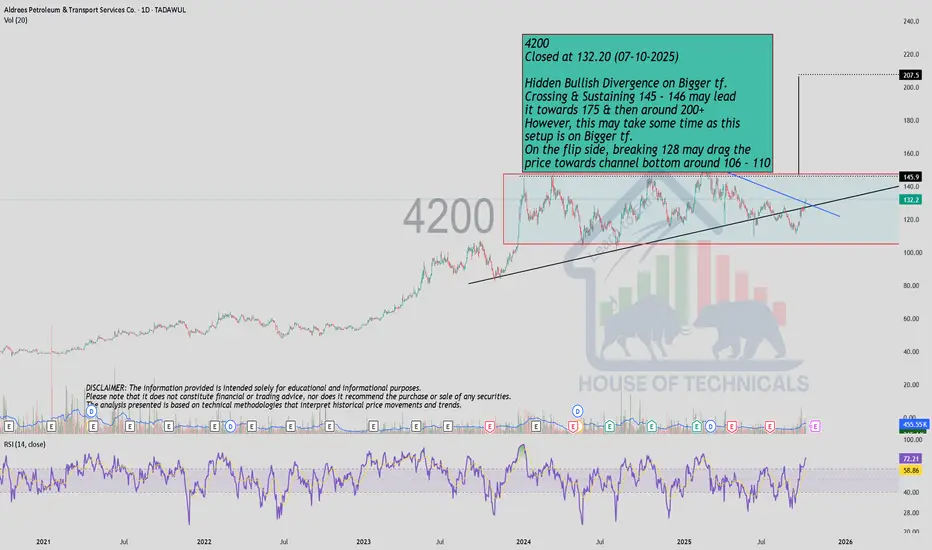
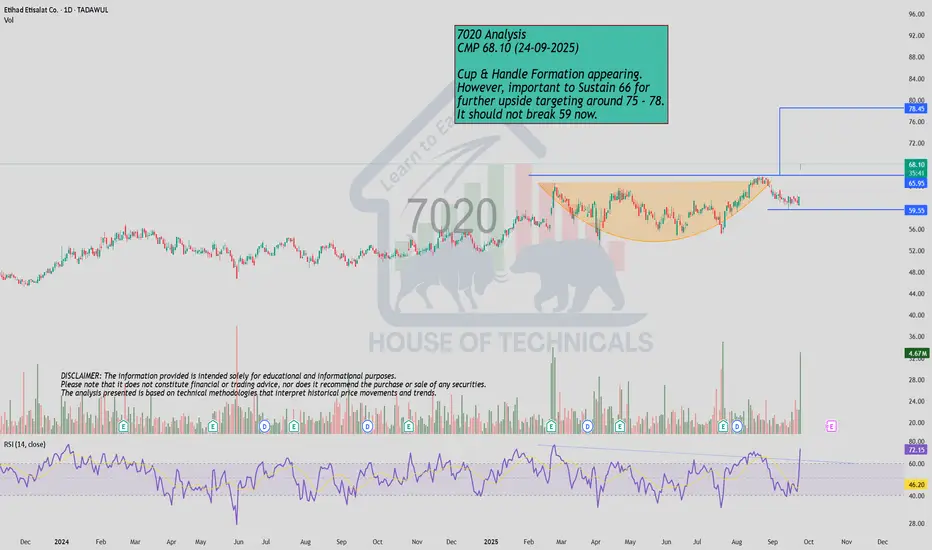
Hidden Bullish Divergence on Bigger tf.4200
Closed at 132.20 (07-10-2025)
Hidden Bullish Divergence on Bigger tf.
Crossing & Sustaining 145 - 146 may lead
it towards 175 & then around 200+
However, this may take some time as this
setup is on Bigger tf.
On the flip side, breaking 128 may drag the
price towards channel bottom around 106 - 110
Bullish Harmonic Pattern on Flynas Co. (4264) Targeting 85–87 ZoOn the 4H chart of Flynas Co. (4264, TADAWUL), a potential bullish harmonic structure is forming, suggesting continuation to the upside. The pattern aligns with the classic ABCD completion, projecting towards the 85.0–87.0 range.
Pattern Formation:
The XA leg retracement shows a clean 0.936 retracement into point B.
The BC leg extends to 2.009, confirming harmonic alignment.
Point C sits around the 0.547 retracement of AB, creating symmetry.
Price Action Context:
Strong support is visible near 7
2330 Technical & Fundamental Analysis: Bullish Setup in Play2330 (Advanced Petrochemical Co.)
Technically, the stock is trading within an ascending channel and recently bounced from it support, offering an attractive risk-to-reward opportunity. The structure favors continuation toward the channel resistance at 36–37, which also aligns with the previous higher high. Price is also trading above the 89 EMA, a level it has historically respected, with RSI in sync to support the bullish momentum.
On the fundamental side, Advanced Petrochemical has delivered
4040 Technical Analysis: Double Bottom + weekly divergence4040 (Saudi Public Transport Co.)
Price has bounced from a key weekly support zone, forming a double bottom with strong bullish divergence on the weekly timeframe. On the daily chart, it has broken out of a downward trendline and successfully retested it, reinforcing the bullish outlook.
The first buy is at CMP, with Buy 2 positioned lower to average in case of a pullback. TP1 and TP2 are aligned with near-term resistances, while sustained momentum beyond TP2 opens room to ride the trend with
2350 Technical Analysis: Breakout with Weekly Bullish Signals2350 (Saudi Kayan Petrochemical Co.)
Price has broken out above the previous high, which had also been a major resistance level since May. It is trading above the 55 Fibonacci EMA, a level that has historically served as dynamic support.
On the weekly timeframe, price has broken out of a falling wedge, confirmed a double bottom, and printed bullish divergence — all of which strengthen the bullish outlook.
The first buy is at CMP, with Buy 2 positioned lower to average in on a pullback. TP1 and
4090 Technical Analysis: Bullish Setup in Play4090 (Taiba Investment Company)
Price bounced from strong weekly support, followed by a breakout from the downward trendline. A bullish divergence on RSI, along with a classic “Three White Soldiers” pattern, reinforces the bullish outlook.
The first buy is positioned at CMP, with Buy 2 placed in case of a healthy dip to secure a stronger average. Risk is managed with a stop below weekly support at 35, while profit targets aim to capture the next leg of upside momentum.
Recommended Levels:
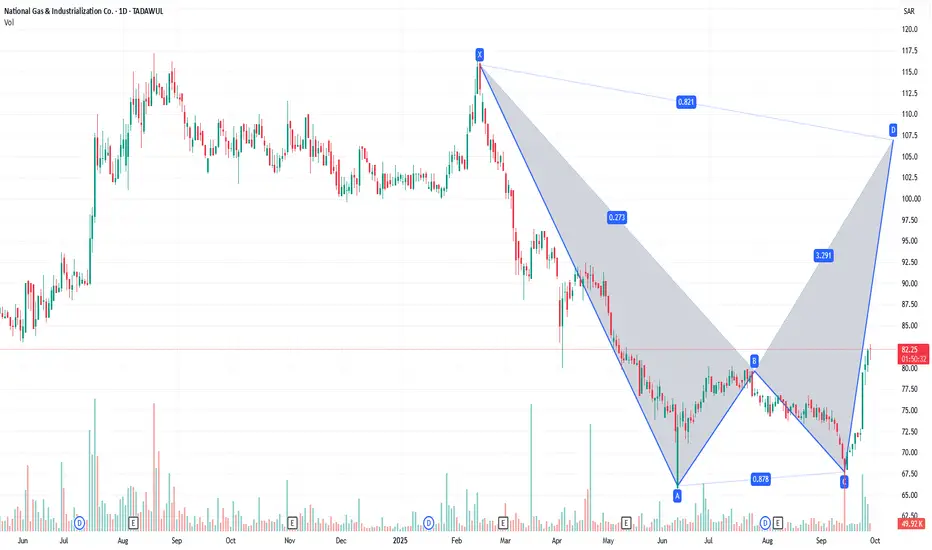
4150It’s a harmonic reversal pattern that signals a potential bearish trend reversal after a bullish move. It has five points (X, A, B, C, D) and four legs (XA, AB, BC, CD).
XA → First bullish impulse leg.
AB → Retracement of XA, typically 78.6% of XA.
BC → Extends AB, usually 38.2% – 88.6% of AB.
CD → Final leg, an extension of XA, reaching 127.2% – 161.8% of XA, completing the pattern.
Buy Plan – Abdullah Al Othaim Markets Co.📈 Buy Plan – Abdullah Al Othaim Markets Co.
Entry:
Buy on continuation above the breakout zone (blue line).
Stop Loss (SL):
Place SL below the recent support area / consolidation base.
Targets:
First Target → Nearest resistance level
Second Target → Major resistance above
Final Target → Liquidity zone (red dotted line)
Plan Notes:
This is a breakout continuation setup.
Once the first target is reached, move SL to breakeven.
Take partial profits step by step and let remaining position
Buy Plan – Saudi Ground Services Co.📈 Buy Plan – Saudi Ground Services Co.
Entry:
Buy on continuation above the recent CISD zone confirmation.
Stop Loss (SL):
Place SL just below the CISD support zone.
Targets:
First Target → Previous resistance
Second Target → Major resistance level
Third Target → Higher resistance
Final Target → Long-term resistance
Plan Notes:
This is a swing buy setup; patience is required to hold for higher targets.
Move SL to breakeven once the first target is reached.
Take partial profits at ea
7200 | Al Moammar Information Systems CompanyThe weekly and monthly outlook has recently turned bullish, and we are targeting an 11% gain over the next 30 days in line with our Tadawul objectives — staying disciplined with high-quality entries, protecting downside risk, and keeping our eyes on steady, achievable growth milestones.
Every trade setup we share contributes to building consistent, measurable progress toward our long-term Tadawul goals.
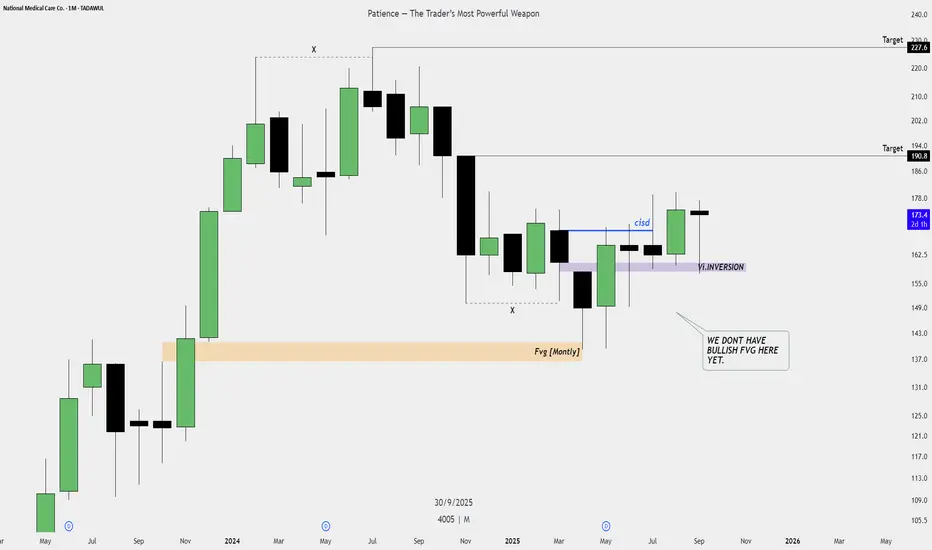
Concise Buy Plan: National Medical Care Co.
This plan aims to capitalize on the recent shift in market momentum to the upside.
1. **Market Context:** The asset has shown a clear **Change in State of Delivery (cISd)**, indicating a shift from sell-side control to buy-side momentum. The bias is now bullish.
2. **Entry Strategy (The Buy):** Wait for a **retracement** (pullback) to a key institutional support zone.
* **Primary Entry:** The **VI.INVERSION** level, a high-probability zone wh
National Metal Manufacturing & Casting Co Monthly Buy PlanNational Metal Manufacturing & Casting Co (TASI) - Monthly Buy Plan
This plan is based on price action and institutional flow concepts, focusing on marked structural levels rather than specific numerical values.
I. Market Context
The stock is currently trading after a strong displacement from a previous low, indicating a potential shift in momentum from the long-term structural downtrend. The focus is on the current reaction at the perplotion block (P.OB) zone, which may serve as a launching pa
Saudi Stock 1111 – TECH BUY CALL by THE CHART ALCHEMIST 28 Sept Saudi Stock 1111 – TECH BUY CALL by THE CHART ALCHEMIST
28 Sept 2025 (1D TF)
The stock is moving in a bullish channel (marked in light blue) on a higher time frame. After making a high of SAR 285.6, it went into a bearish leg (marked in light pink) within the channel. The stock has recently broken out of this bearish leg and moved upwards. We expect it to continue moving upwards.
📢 Disclaimer: Technical analysis by Mushtaque Muhammad (The Chart Alchemist).
Saudi National Bank (1180) -28 Sept 2025 (1W TF)Saudi National Bank (1180) – TECH BUY/INVESTMENT CALL by THE CHART ALCHEMIST
28 Sept 2025 (1W TF)
After making a previous high of SAR 61.45, the stock went into a corrective mode in a tight channel (marked in light blue). It broke out and performed an automatic rally in a Wyckoff accumulation phase (marked in yellow). After touching the bottom support level around SAR 32, the stock reversed upwards and constructed multiple bullish structures.
📢 Disclaimer: Technical analysis by Mushtaque Muham
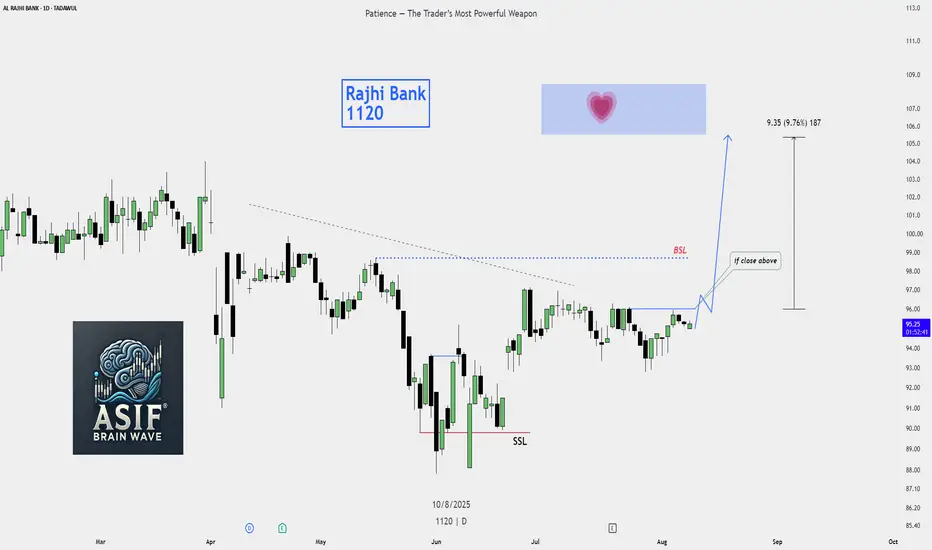
Buy Plan – Al Rajhi Bank (1120)Buy Plan – Al Rajhi Bank (1120)
Current Price: 95.20
Entry Trigger: Wait for a daily candle close above BSL (~96).
Target: 105–107 zone (approx. +9.76%).
Stop Loss: Below BSL or near 93.
Rationale:
SSL has already been taken, indicating potential shift to bullish momentum.
Break above BSL confirms buyer strength and opens the path toward the target zone.
The blue zone with the ❤️ mark is the main liquidity target area.
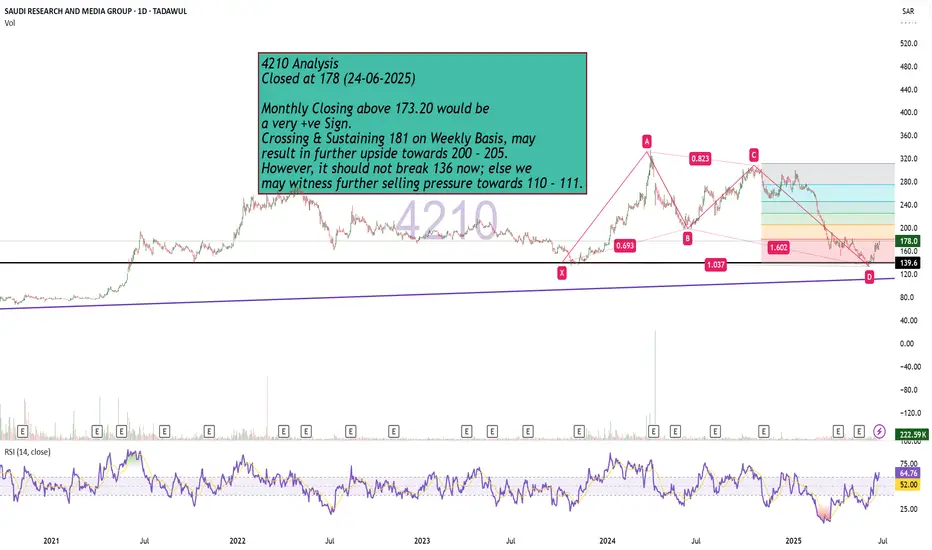
Bullish Monthly Candle Expected?4210 Analysis
Closed at 178 (24-06-2025)
Monthly Closing above 173.20 would be
a very +ve Sign.
Crossing & Sustaining 181 on Weekly Basis, may
result in further upside towards 200 - 205.
However, it should not break 136 now; else we
may witness further selling pressure towards 110 - 111.