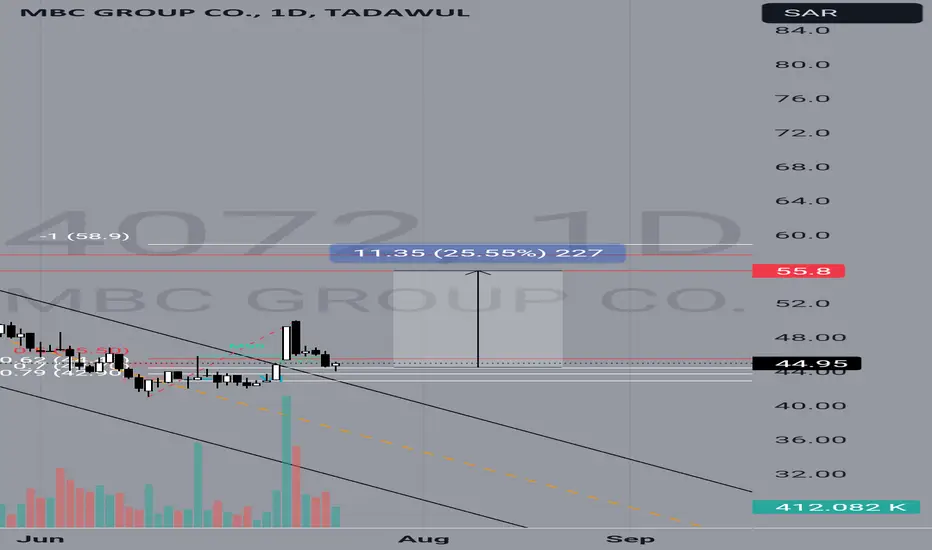
MBC long This is best apparently to get up with MBC group There is a sine of reflection has been begun 44.40 The TP is 55 Stop losing under 42.90Longby z_abdullah1
Play on LevelsPlan1 Buy Above 46 (if Sustained) Sell around 50 - 51 Plan2 Buy1 around 43 - 43.50 Buy2 around 39.70 - 41.30 Sell around 45 - 45.50 Stoploss 38.50 (closing basis) by House-of-TechnicalsUpdated 21
2001 Methanol Chemicals: Monthly Bullish Order Block ReactionGreetings, traders! 🌟 I’ve identified a compelling setup in the 2001 Methanol Chemicals market on the monthly chart. Join me as we explore the potential for a lucrative trade opportunity. Analysis: Bullish Order Block Identification: On the monthly timeframe, a clear bullish order block is developing in the 2001 Methanol Chemicals market. This zone typically signifies sustained buying interest and potential for upward movement. Key Price Tab Reaction: Recently, there’s been a significant reacLongby Asif_Brain_Waves1
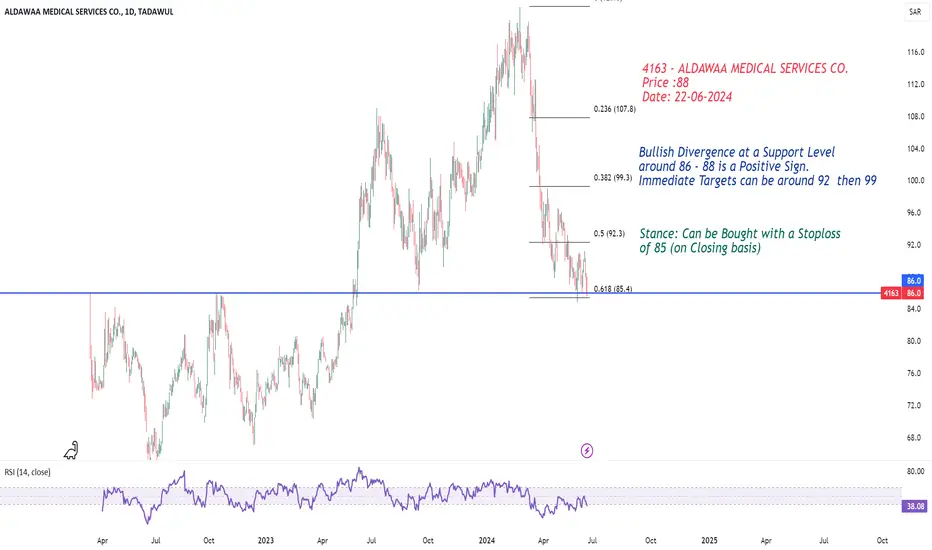
Buy SideBullish Divergence at a Support Level around 86 - 88 is a Positive Sign. Immediate Targets can be around 92 then 99by House-of-TechnicalsUpdated 3
2223Great opportunity again to take a position in the company, targets are the red lines and the stoploss is 128. Dr SAUDLongby DrSaud10
4220 Emmar 12% profit 4220 Emmar 12% profit with low cost. The company has a huge projects that are working on and 6.5 is undervalued. It has a gap to be filled with 12% profit from 6.5 and stop line is under 6.3Longby MeshariSultan11
Buy CallBuy1 @ CMP or around 92 Buy2 around 88 - 89 Sell around 99 - 100 Stoploss 87 (closing basis)by House-of-TechnicalsUpdated 0
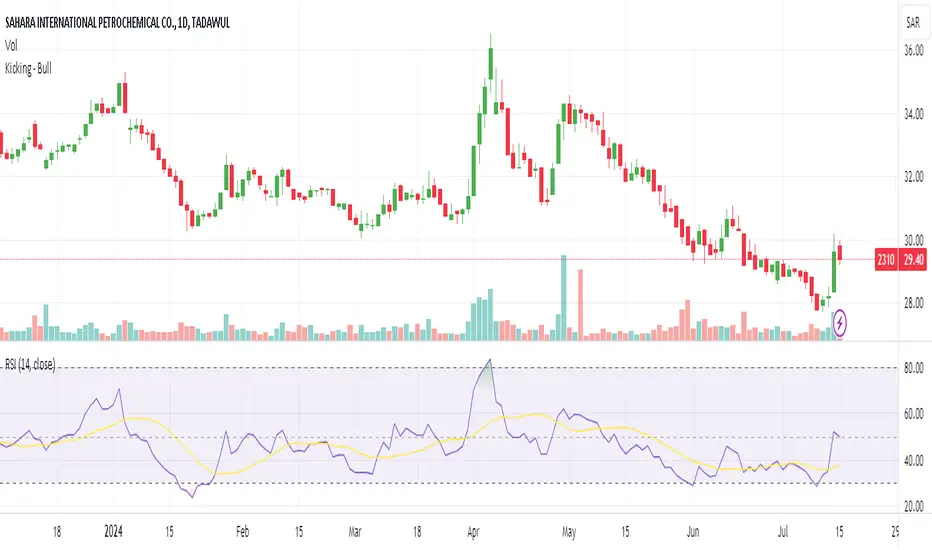
Morning StarMorning Star Formation on Daily TF. Bullish Divergence on Hourly TF.by House-of-TechnicalsUpdated 1
3007 Zahrat Al Waha long As we see Zahrat Alwaha is ready to achieve the first TP1 at 44.70 The stop is 39.40 Longby z_abdullah0
Weekly RSI MACD Fibonacci//@version=5 indicator("Weekly RSI MACD Fibonacci", overlay=true) // Get the weekly data symbol = syminfo.tickerid weekly_close = request.security(symbol, "W", close) // RSI Calculation rsi_length = input.int(14, title="RSI Length") rsi_overbought = input.int(70, title="RSI Overbought Level") rsi_oversold = input.int(30, title="RSI Oversold Level") rsi = ta.rsi(weekly_close, rsi_length) // MACD Calculation macd_length_short = input.int(12, title="MACD Short Length") macd_length_long = input.iby abasaud0
TANMIAH: Trendline Support_BullishTanmiah is respecting a trendline support A recent resistance (horizontal line) is broken and converted into support. A retest at new support line is observed. Aggressive and conservative entry levels with SL are specified with TPs. Manage your risk accordingly.Longby YASIRWA21
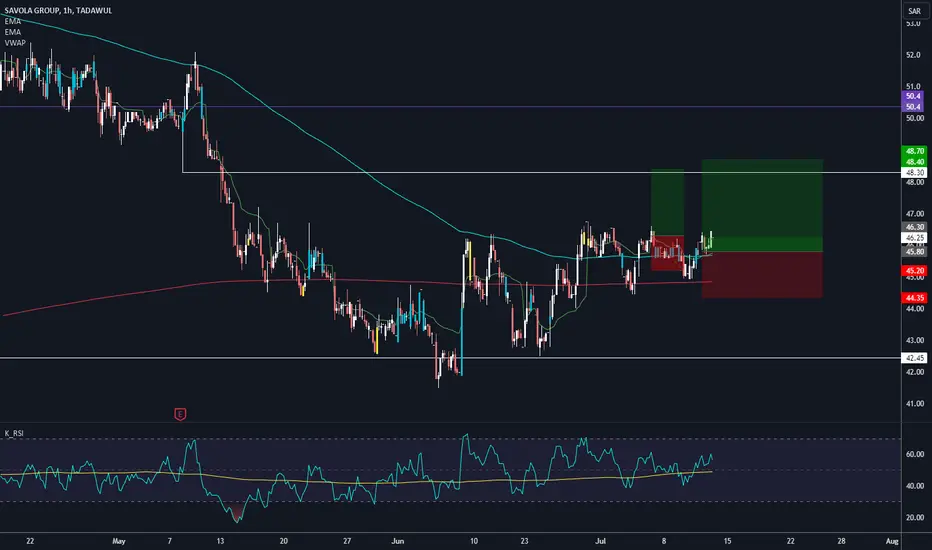
Savola group 2050 - Bullish Signs Show some strong signs: 1- Break 200 ma 2- Break Daily 200 ma 3- Break VWAP Price Target TP1: 48.3 TP2: 50.4Longby K_M_M21
alsaif gallery heading down to fibo supportas we see on the chart we've got a correction wave heading down to the fibo support if everything goes well we've got a beautiful price range between 9.15-8.95 sarLongby lionardo31Updated 3
2381: Buy ideaBuy idea on 2381 as you see on the chart if only if we have the breakout with force the vwap and the resistance Line.Longby PAZINI194
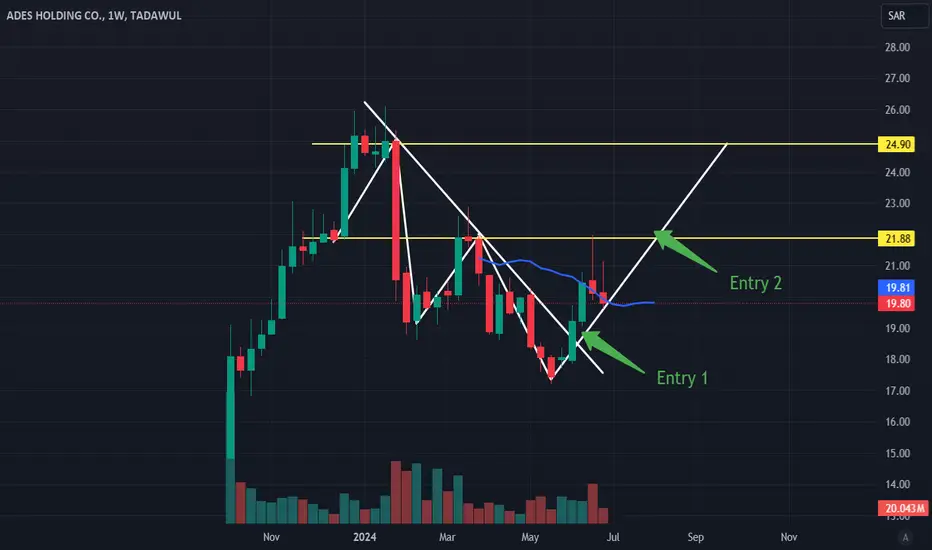
ADES: dragon patternADES holding had created dragon pattern, first target is 21.88 SAR and second target 24.9 SAR. This supported by HSBC recent recommendation for ADES holding at 24.9 SARLongby Ammarxv14110
8270A breakout is a term used in technical analysis to describe a situation where the price of an asset moves beyond a defined support or resistance level with increased volume. Breakouts can signal the start of a new trend, either bullish or bearish, depending on the direction of the breakout. Characteristics of a Breakout: Price Movement: The price moves above a resistance level (bullish breakout) or below a support level (bearish breakout). Volume: A breakout is often confirmed by an increase i8Longby B9A-88652-NisarAhmad3
8120"Strong support" refers to a price level on a chart where an asset consistently finds buying interest, preventing the price from falling further. This level is identified by multiple touches or tests where the price reaches this point and bounces back up. Characteristics of Strong Support: Multiple Touches: The more times a price level has been tested and held, the stronger the support level becomes. Volume Confirmation: High trading volume at the support level can indicate strong buying interLongby B9A-88652-NisarAhmad1
8030 A rising wedge is a bearish chart pattern used in technical analysis. It is formed when the price of an asset is making higher highs and higher lows, but the highs and lows are converging towards each other, creating a wedge-like shape that slopes upward. Here are the key characteristics and implications of a rising wedge: Shape: The pattern is bounded by two trendlines – an upward sloping resistance line connecting higher highs and an upward sloping support line connecting higher lows. These Longby B9A-88652-NisarAhmad0
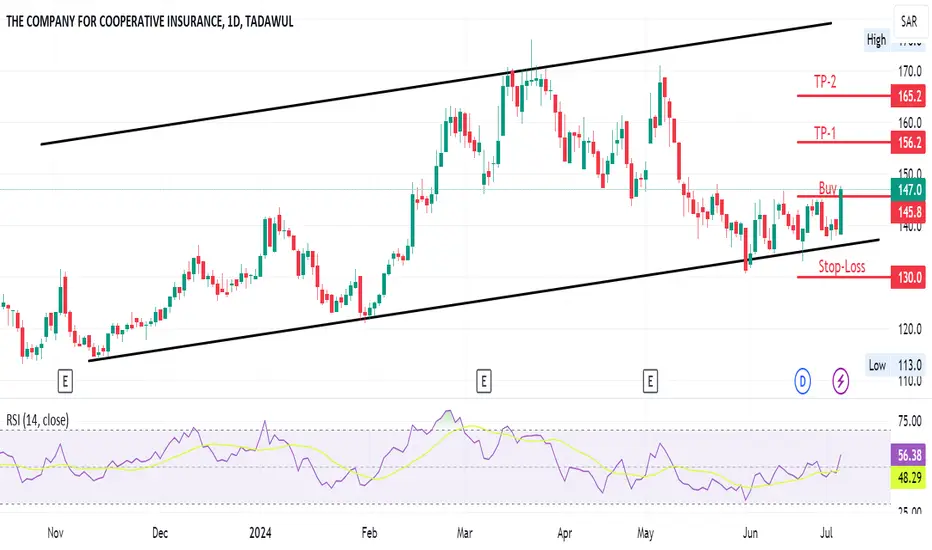
The Company for Coop. Insurance"Higher high" is a term often used in technical analysis of financial markets. It refers to a price point that is higher than the previous high price in a given period, indicating an upward trend. This concept is part of the pattern analysis used by traders to predict future price movements and make trading decisions. Longby B9A-88652-NisarAhmad0
2010: Buy ideaBuy idea on 2010 as you see on the chart if only if we have the breakout with force the resistance line by a big green candle.Longby PAZINI192
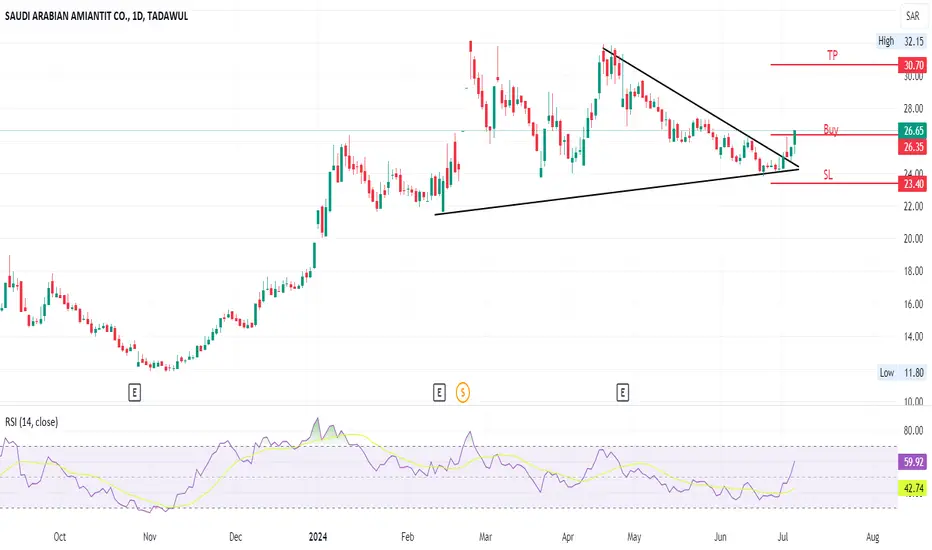
2160A symmetrical triangle is a chart pattern used in technical analysis that typically forms during a trend as a continuation pattern. It is characterized by two converging trendlines connecting a series of sequential peaks and troughs. The upper trendline is downward sloping, while the lower trendline is upward sloping. Here are some key points about symmetrical triangles: Formation: Symmetrical triangles occur when the price action of an asset is consolidating and moving into a tighter range. ILongby B9A-88652-NisarAhmad2
4050Welcome, dear ambitious people, we are all looking for money, but there are some people who cannot know the direction of the arrow, so I offer you this golden opportunity that cannot be missed, and thank you.Longby Jassim201
cup and handle for fibcowe got a perfect confermation for the cup and the handle got a nice chanel we just gonna need to wait for the confirmation trendLongby lionardo31Updated 12
 LongLong

 Long

 Long
 Long


 Long

 Long
 Long
 Long
 Long
 Long
 Long
 Long
 Long
 Long
 Long
 Long
 Long