Al Ashghal Al Moysra (9608) : Correction for the Next Rally ?TADAWUL:9608
🚀 Daily 200 EMA in Focus: Rejection Could Build the Next Bullish Structure 📈
The stock is approaching one of the most significant technical barriers on the chart—the Daily 200 EMA, currently positioned near 18.60.
This level is likely to determine whether price extends its rally immediately or first builds a healthier trend before the next move.
🔍 Technical Outlook
The broader price structure continues to improve, but the Daily 200 EMA remains a major dynamic resistance that deserves close attention.
A rejection at this level would not necessarily be bearish. Instead, it could provide the ideal setup for a stronger and more sustainable uptrend.
📊 The Bullish Scenario
If price faces resistance around 18.60, a controlled pullback could help establish a Higher High–Higher Low (HH-HL) market structure.
This would strengthen the bullish trend by allowing momentum to reset before buyers attempt another breakout.
🎯 Key Support Levels
Should a correction unfold, these zones will be critical to monitor:
📍 First Support: 17.00 – Initial demand zone where buyers may step in.
📍 Second Support: 15.30 – A stronger technical support area that could provide an attractive accumulation opportunity if tested.
A successful defense of either support zone would reinforce the bullish structure and improve the probability of trend continuation.
🚀 Upside Targets
If the stock successfully absorbs selling pressure and reclaims the Daily 200 EMA, the next technical objectives become:
🎯 Target 1: 21.00
🎯 Target 2: 25.00
🎯 Target 3: 27.50
These levels represent the next major resistance zones where momentum and profit-taking should be monitored.
📊 My View
The trend is showing signs of improvement, but 18.60 remains the make-or-break level.
✅ A breakout above the Daily 200 EMA could accelerate bullish momentum toward 21, 25, and eventually 27.50.
🔄 A rejection, followed by a healthy pullback to 17.00 or 15.30, would not invalidate the bullish outlook. Instead, it could create a stronger Higher High–Higher Low (HH-HL) structure and provide a more favorable risk-to-reward entry.
Would you chase the breakout above the 200 EMA, or wait for a Higher Low before adding to your position? Share your trading strategy below! 👇
⚠️ Financial Disclaimer
Disclaimer: This analysis is for educational and informational purposes only and should not be considered financial or investment advice. Always perform your own research and practice sound risk management before trading.
#Tadawul #SaudiStockMarket #SaudiStocks #TASI #SaudiInvesting #SaudiTrading #KSAStocks #SaudiInvestors #SaudiEquities #MiddleEastMarkets
#TechnicalAnalysis #TradingView #PriceAction #MarketStructure #EMA200 #HigherHigh #HigherLow #BullishTrend #Breakout #SwingTrading #TrendFollowing #SupportAndResistance #MomentumTrading #ChartAnalysis #TradingIdeas #RiskManagement #StockMarket #Investing #BullishSetup #WiSHFundManagement  Long
Long
Tabuk Agri (6040) : Any Pullback is an Opportunity for UpsideTADAWUL:6040
🚀 Bullish Momentum Intact — Waiting for the Ideal Pullback Opportunity 📈
This stock has been one of the stronger performers in recent sessions, delivering an impressive upside move and confirming that buyers remain firmly in control.
While the broader trend has turned bullish, chasing the current rally may not offer the best risk-to-reward.
🔍 Technical Outlook
The stock is currently trading in a bullish market structure, but the next high-probability opportunity may come after a healthy correction.
Rather than buying into strength, I'm watching for a retest of the Daily 200 EMA, which could act as a key dynamic support level.
A successful retest would reinforce the breakout and improve confidence in the continuation of the uptrend.
🎯 What I'm Watching
📌 Primary Support: Around 7.50
This zone aligns with a potential Higher Low (HL) formation and could provide a favorable area for buyers to step back in.
The ideal bullish setup would include:
✅ Retest of the Daily 200 EMA
✅ Formation of a Higher Low (HL)
✅ Bullish price action confirmation with increasing volume
🚀 Upside Potential
If the pullback holds and the bullish structure remains intact, the next technical objective could be around:
🎯 Target Price: 13.00
This offers an attractive reward relative to the anticipated support zone, provided the market confirms the continuation setup.
📊 My View
The trend is already pointing higher—but patience could provide the better entry.
Instead of chasing an extended move, I'd rather wait for:
✔️ A healthy correction
✔️ A confirmed Higher Low
✔️ Support at the Daily 200 EMA
In trending markets, buying strength after confirmation often outperforms buying excitement at the highs.
Would you buy the current momentum, or wait for the Higher Low before building a position? Let me know your strategy in the comments! 👇
⚠️ Financial Disclaimer
Disclaimer: This analysis is shared for educational and informational purposes only and does not constitute financial or investment advice. Always conduct your own research and apply appropriate risk management before making investment decisions.
#Tadawul #SaudiStockMarket #SaudiStocks #SaudiInvesting #SaudiTrading #TASI #SaudiInvestors #KSAStocks #SaudiEquities #MiddleEastMarkets
#TechnicalAnalysis #TradingView #PriceAction #MarketStructure #EMA200 #HigherLow #BullishTrend #SwingTrading #Breakout #TrendFollowing #SupportAndResistance #MomentumTrading #ChartAnalysis #TradingIdeas #StockAnalysis #RiskManagement #Investing #StockMarket #BullishSetup #WiSHFundManagement
 Long
Long
Saudi Paper (2300) : Start of a Major Bullish Reversal ?TADAWUL:2300
🚀 Rounding Bottom in Play: Is This the Start of a Major Bullish Reversal? 🇸🇦
The stock is showing a classic rounding bottom formation, a technical pattern that often signals the transition from a prolonged accumulation phase to a new bullish trend.
Price is now approaching a critical breakout level around 80, where the next major move could be decided.
🔍 Technical Outlook
The rounding bottom suggests that selling pressure has gradually weakened while buyers continue to gain control.
However, confirmation is still required.
📌 Key Breakout Level: 80
A sustained breakout and close above this level would significantly improve the bullish outlook and confirm the reversal pattern.
🚀 Bullish Scenario
If price successfully reclaims and holds above 80, the rounding bottom breakout could trigger a fresh momentum rally toward:
🎯 Target 1: 100
🎯 Target 2: 120
These levels represent the next major resistance zones where traders may consider monitoring for profit-taking or continuation signals.
⚠️ Bearish Scenario
Failure to sustain above the 80 resistance would weaken the breakout thesis.
In that case, the stock may revisit its previous breakout–retest zone around 46, an area that historically acted as a strong support and could once again attract buyers.
A successful defense of this level would keep the longer-term bullish structure alive.
📊 My View
The stock is approaching a high-conviction technical decision point.
✅ Above 80: Confirms the rounding bottom and increases the probability of a rally toward 100–120.
⚠️ Failure at 80: Could trigger a corrective move back to the 46 support zone, where the next buying opportunity may emerge.
Patience is key—let the market confirm the breakout before chasing the move.
Do you think this rounding bottom is ready to launch the next bullish leg, or will price revisit 46 before the breakout? Share your view below! 👇
⚠️ Financial Disclaimer
Disclaimer: This analysis is provided for educational and informational purposes only and should not be considered financial, investment, or trading advice. Always perform your own research (DYOR) and apply proper risk management before making any investment decisions.
#Tadawul #SaudiStockMarket #SaudiStocks #TASI #SaudiInvesting #SaudiTrading #SaudiInvestors #KSAStocks #SaudiEquities #RiyadhMarket #MiddleEastMarkets #GCCMarkets
#TechnicalAnalysis #TradingView #PriceAction #MarketStructure #RoundingBottom #BullishReversal #Breakout #SupportAndResistance #SwingTrading #TrendFollowing #MomentumTrading #ChartPatterns #StockAnalysis #TradingIdeas #Investing #StockMarket #BullishSetup #RiskManagement #WiSHFundManagement  Long
Long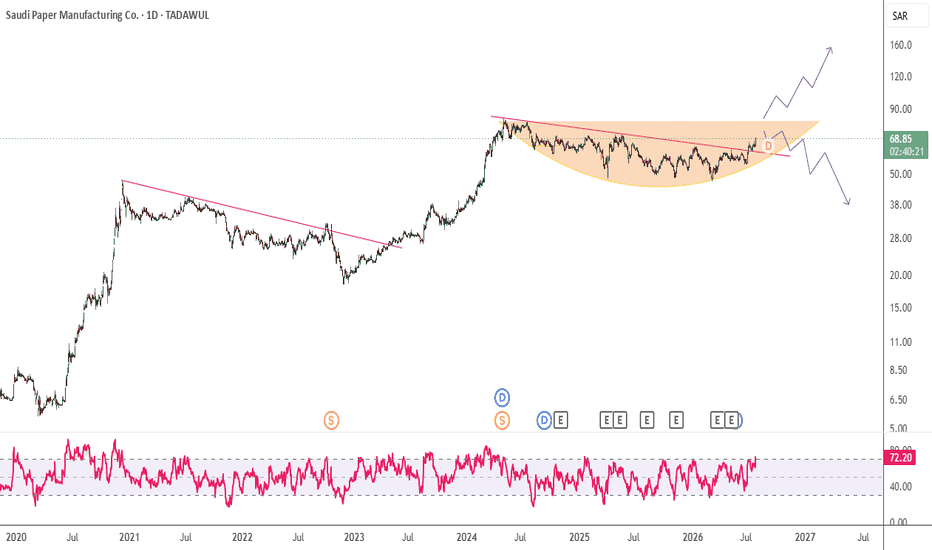
 Long
Long
ELM (7203): Watching for a Fibonacci BreakoutI've been keeping an eye on ELM, and the chart is starting to look interesting. After spending months in a downtrend, the price seems to be finding its footing. It has been making higher lows while staying above the 602 SAR support, which is usually a good sign that buyers are slowly coming back.
Right now, the biggest level to watch is around 691 SAR. This is where the long-term descending trendline meets the 23.6% Fibonacci level, making it an important resistance area. If the price can close above this level with strong volume, it could be an early sign that the trend is finally changing.
If that breakout happens, the next Fibonacci levels I'm watching are:
805 SAR (38.2%)
897 SAR (50%)
989 SAR (61.8%)
1120 SAR (78.6%)
For now, I think patience is the best approach. The chart is definitely improving, but I'd like to see a confirmed breakout before getting too excited.
Trade Idea
Entry: 680–695 SAR (or wait for a confirmed close above 691 SAR)
TP1: 740 SAR
TP2: 805 SAR
TP3: 897 SAR
TP4: 989 SAR
TP5: 1120 SAR
Stop Loss: 645 SAR (or below 602 SAR for a longer-term swing)
This setup has a few things lining up nicely an ascending trendline, strong support around 602 SAR, and Fibonacci levels acting as clear targets. If buyers can push through 691 SAR with convincing volume, I think this chart could become much more interesting. National Medical Care : Is the Long-Term Trend Still at Risk?TADAWUL:4005
📉 Distribution Above 150–220: Is the Long-Term Trend Still at Risk? ⚠️
Price spent a considerable period in a distribution range between 150 and 220, suggesting significant supply was being absorbed by the market.
The 200 EMA remained in a strong uptrend until October 2024. However, the subsequent breakdown below this key long-term moving average marked a significant shift in market structure.
The brief recovery above the 200 EMA may have acted as a bull trap, attracting long-term buyers before price resumed its downward movement. Meanwhile, short-term traders who recognized the failed recovery may have benefited from the resulting volatility.
🔍 What Should We Watch Going Forward?
The key question now is whether price can reclaim its long-term trend structure.
📌 First condition: Price must reclaim and sustain above the 200 EMA.
📌 Second condition: Sustained trading above the 130s would be necessary to rebuild the broader trend structure.
📌 Accumulation trigger: A sustained move back above the 150s could provide a stronger signal to begin gradually building positions.
⚠️ Bearish Scenario
Until these levels are reclaimed and held, the market may continue to experience sell-on-strength rallies.
If weakness persists, the next major downside zone could potentially be around 85.
📊 My View
For now, patience remains key.
I would prefer to see price reclaim the 200 EMA, establish itself above the 130s, and eventually regain the 150s before becoming more constructive on long-term accumulation.
Until then:
Rallies may continue to face selling pressure.
👀 Is the market forming a long-term bottom, or is this simply another relief rally within a broader downtrend?
Share your view below. ⬇️
#TechnicalAnalysis #TradingView #PriceAction #MarketStructure #Distribution #EMA200 #200EMA #MovingAverage #TrendAnalysis #SellOnStrength #BullTrap #BearishTrend #SupportAndResistance #SwingTrading #LongTermInvesting #StockAnalysis #TradingIdeas #TechnicalTrader #PriceActionTrading #MarketOutlook #Accumulation #Breakdown #TrendFollowing #Investing #StockMarket #WiSHFundManagement  Short
Short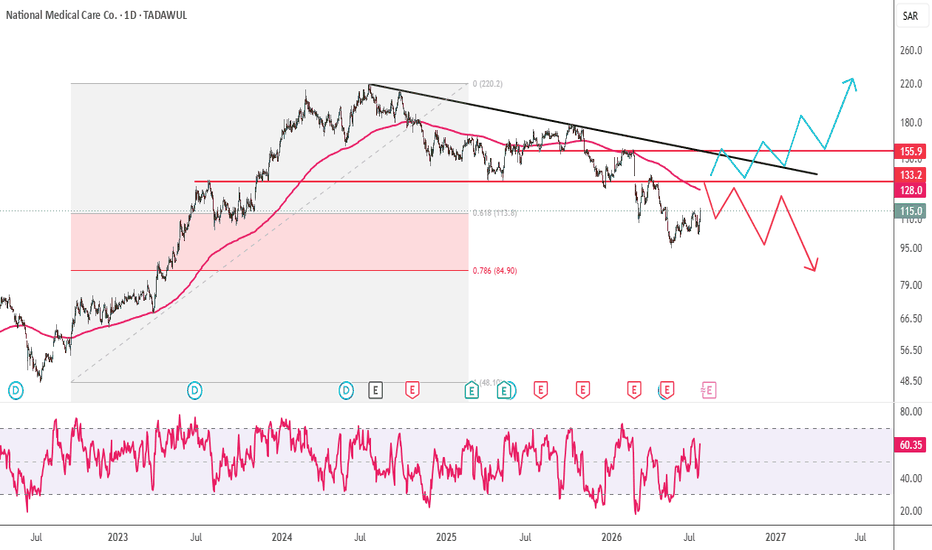
 Long
Long
 Long
Long
Yanbu National PetroChem : Is the Next Leg Up Forming ?TADAWUL:2290
📈 EMA 200 Retest + Bullish Divergence: Is the Next Leg Up Forming?
Price is now approaching the 200-week EMA at 34.23—a level that has historically acted as a major decision zone.
Looking at previous price behavior, the asset has repeatedly struggled to sustain above the 200-week EMA and experienced significant pullbacks around:
🔹 July 2023
🔹 October 2024
🔹 September 2025
🔹 April 2026
However, the current setup is showing some important differences.
The weekly chart has formed a bullish divergence, followed by a strong recovery. From the previous week's high, price advanced approximately 43%—while the weekly low-to-high measurement represents a total move of nearly 61%.
Following that advance, price once again failed to sustain above the 200-week EMA and entered a corrective phase, eventually declining toward 29.
This level is particularly significant as it represents the 0.618 Fibonacci retracement zone of the major swing from 24 to 38.7—a classic discounted accumulation area.
💡 Why this setup is interesting:
In my experience, the combination of:
✅ Bullish weekly divergence
✅ Formation of a higher low
✅ Price holding above the 200-week EMA
✅ A confirmed discounted Fibonacci retracement
✅ Positive market structure
can create a powerful confluence for the next potential expansion phase.
Using the Fibonacci Extension tool, the initial upside projections currently point toward:
🎯 43
🎯 52
These levels represent the first major upside objectives if the bullish structure remains intact and price successfully sustains above the key EMA 200 zone.
📌 The key question now is not whether price can rally—but whether it can finally sustain above the 200-week EMA.
📌 In case of rejection from Ema200, price may reverse towards 27-26 price zone.
A successful breakout and hold could significantly strengthen the bullish continuation case.
⚠️ As always, this is a technical analysis perspective—not financial advice. Key support and invalidation levels should be monitored closely.
#TechnicalAnalysis #PriceAction #BullishDivergence #EMA200 #Fibonacci #FibonacciRetracement #FibonacciExtension #HigherLow #MarketStructure #SwingTrading #TrendAnalysis #StockMarket #TradingIdeas #TradingView #Investing #TechnicalTrading #Breakout #BullishSetup #MomentumTrading #LongTermInvesting #TradingStrategy  Long
Long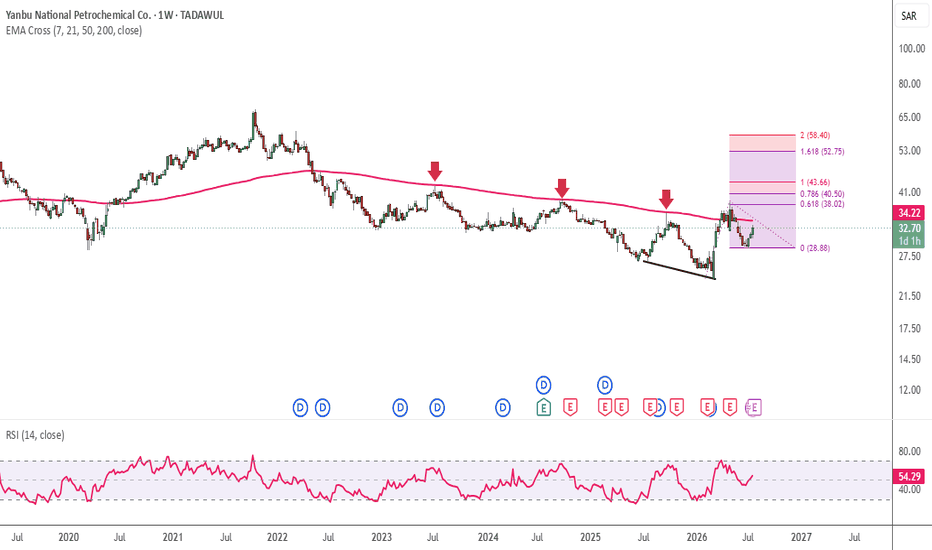
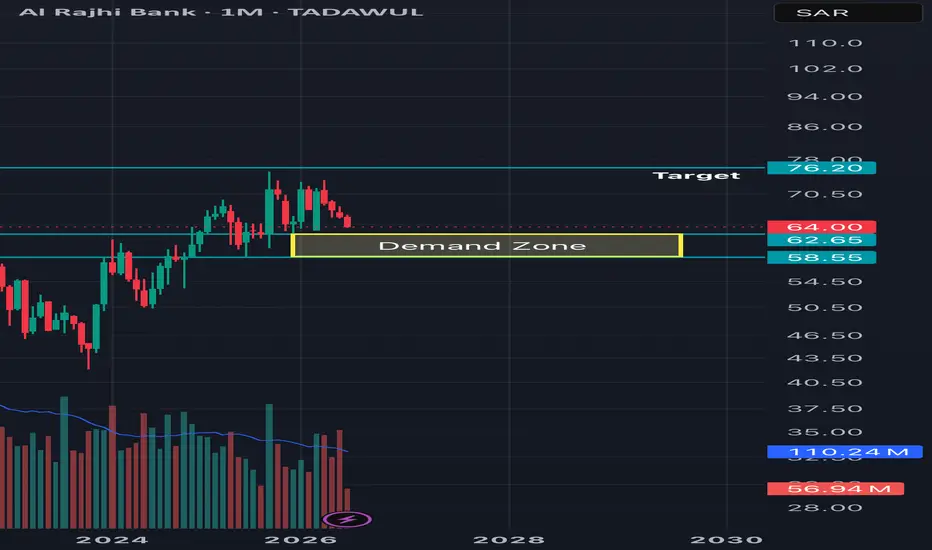
Al Rajhi Bank: Strong Q2 ResultsAl Rajhi Bank reported another strong quarter, and in my opinion the market reaction was more influenced by higher provisions than by the overall quality of the results.
Here are the key numbers:
* Net profit increased 14% YoY to SAR 13.8B.
* Operating income grew 13.9%.
* ROE remained very strong at 23.3%.
* Net financing margin improved to 3.50%.
At first glance, the increase in provisions looked negative. However, when looking deeper into the report, credit quality remains excellent:
* NPL ratio: 0.74%
* Coverage ratio: 153%
* Cost of risk: 0.39%
To me, these numbers indicate that the bank remains financially strong and that the higher provisions reflect a more conservative approach rather than a deterioration in asset quality.
The balance sheet also continues to be one of Al Rajhi’s biggest strengths, supported by strong capital, healthy liquidity, and a high CASA ratio.
Valuation
After updating the financials following Q2 results, I estimate the intrinsic value around SAR 76 per share under a base-case scenario.
If the bank continues to maintain ROE above 22% while preserving its asset quality, a valuation in the SAR 80–88 range becomes reasonable over the longer term.
Technical View
The stock is currently trading near an important long-term demand zone.
As long as this area holds, I continue to see the long-term trend as positive, with SAR 76 remaining my initial upside target.  Long
Long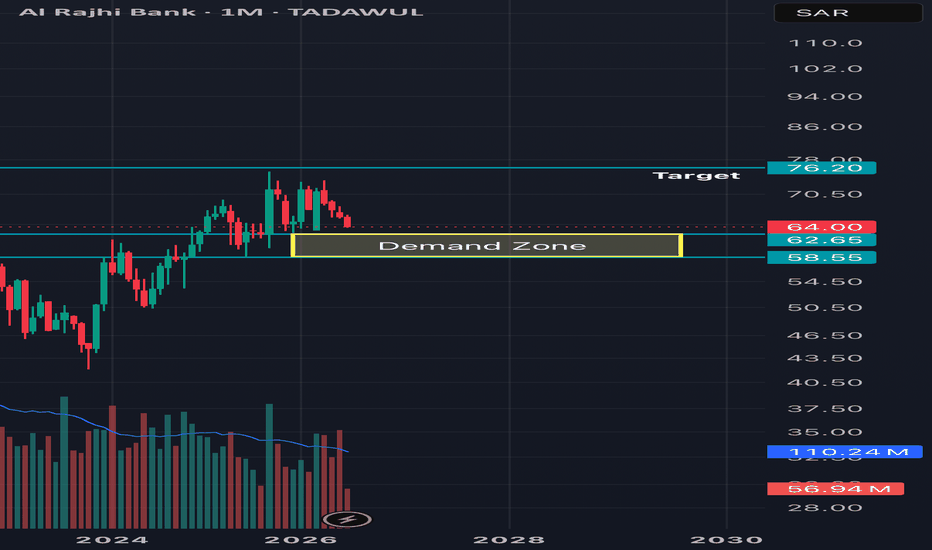
Ma'aden (1211) Descending Channel Meets Long-Term SupportSaudi Arabian Mining Company has been trading in a descending channel after peaking near SAR 80, reflecting a prolonged corrective phase where sellers have remained in control.
Despite the persistent downtrend, price has now reached a long term support zone.
The stock is testing the lower boundary of the descending channel, while simultaneously sitting near a major horizontal support around SAR 56, a level that has previously attracted buyers.
This convergence of support levels creates an area worth monitoring for a potential shift in momentum.
From a volume perspective, selling pressure appears to be going down as compared to the earlier stages of the decline. If buyers begin to absorb supply near current levels, the probability of a relief rally increases.
The first sign of strength would be a breakout above the descending channel.
Can Trade the channel by entering at 57 zone first resistance would be around 59 and next resistance top of the channel at around 60
I will be playing safe and following closely to enter if the price breaks above 60 - 62 zone.
If the price breaks down from 56 zone, it would invalidate the Channel and the next support area will be near 51
Disclaimer:
The information provided is for educational and informational purposes only. It does not constitute financial or investment advice. Trading and investing in stocks involves risk, including the possible loss of capital. Any decisions to buy, sell, or hold securities are the sole responsibility of the reader. Past performance is not indicative of future results. Always do your own research and, if necessary, consult with a licensed financial advisor before making investment decisions. Sedco Capital Reit Fund : From Deep Discount to Potential 14–16TADAWUL:4344
📈 From Deep Discount to Potential 14–16 Target? The Weekly Chart Tells an Interesting Story 🔥
The weekly chart suggests that price may have completed a major accumulation and recovery phase after rebounding from a deep discounted Fibonacci retracement zone of the previous bullish swing from 4.14 to 11.00.
🔍 The Price Structure
After the initial bullish move, price retraced within a descending parallel channel, eventually forming a significant swing low near 5.91 in November 2025.
Since that low, price has demonstrated strong weekly bullish momentum and steadily recovered, despite the severe geopolitical conflict affecting the region during the first half of 2026.
This resilience is an important technical observation.
⚠️ Key Resistance: 8.10–8.25
Price is now approaching a significant resistance zone around 8.10–8.25, which aligns with the 0.5 Fibonacci retracement level.
At this stage, the market may need to cool off before continuing higher.
This could happen through:
🔹 Sideways consolidation
🔹 A controlled technical correction
🔹 A retest of previous breakout levels
🎯 Two Critical Correction Zones
If price experiences a pullback, two areas stand out:
📍 7.13 — Parallel Channel Breakout Retest
A retest of the previous descending channel breakout could provide an important support test.
📍 6.80 — 0.618 Fibonacci Retracement Zone
This area represents the deeper Fibonacci retracement level of the latest bullish swing and could act as a potential demand zone.
🚀 Breakout Strategy
For new positions, chasing price at the current market price may carry a relatively higher risk due to the nearby resistance zone.
A confirmed breakout above 8.25, preferably followed by a successful retest and support confirmation, could provide a more favorable risk-reward entry for momentum traders.
📊 Potential Upside Targets
If the bullish structure remains intact:
🎯 Initial upside target: Around 12.00
This is where the projected AB=CD harmonic pattern could reach completion.
🔭 Extended target zone: 14.00–16.00
A Reverse Fibonacci Extension projection suggests the possibility of a larger measured move toward this region.
🧠 My View
The broader weekly market structure remains bullish, but price is now entering a major technical decision zone.
The key question is:
Will price break above 8.25 and accelerate higher, or will the market first consolidate and retest lower support levels before the next major move?
For me, 8.25 remains the key trigger level, while 7.13 and 6.80 are the important correction and accumulation zones to monitor.
Do you think this is a breakout setup—or does price need one more correction before the next leg higher? 👀
Share your view below. ⬇️
🔖 Hashtags
#Tadawul #SaudiStocks #SaudiStockMarket #TASI #SaudiInvesting #SaudiTrading #SaudiInvestors #TadawulStocks #SaudiMarket #KSAStocks #RiyadhMarket #GCCMarkets #MiddleEastMarkets #StockMarket #Investing #Trading #TechnicalAnalysis #PriceAction #Breakout #SwingTrading #MarketOutlook #StockAnalysis #TradingIdeas #Bullish #Bearish #ChartAnalysis #TradingView #WiSHFundManagement
 Long
Long
 Short
Short
 Long
Long
 Long
Long
 Long
Long
 Short
Short
Al Rajhi Bank: Facing Liquidity and Regional HeadwindsDespite reporting solid Q1 2026 results, with a 14% growth in net profit, several systemic and macroeconomic risk factors could exert pressure on the stock in the medium term. Prolonged instability linked to the Iranian conflict represents a material risk for the entire Saudi banking sector. If the conflict were to escalate, Fitch warns that asset quality, profitability, and bank liquidity could contract, forcing an increase in provisions for credit losses (impairment charges). The sector is facing a contraction in liquidity conditions, with loan-to-deposit ratios hitting record levels across the board. In a stress scenario, Al Rajhi Bank's liquidity position could be tested: estimates indicate that the liquidity coverage on deposits for Al Rajhi, Riyad Bank, and Bank Albilad could fall to critical levels (10% or less) in the event of significant outflows. Growing competition for deposit gathering is driving up the cost of funding. If interest rates remain "higher for longer," banks with a high reliance on certificates of deposit or subject to greater domestic competition would see their net interest margins (NIM) compressed. The massive adoption of fintech, instant payments, and digital banking in Saudi Arabia is "compressing" risk timelines. The need to constantly update Anti-Money Laundering (AML) frameworks and cybersecurity in a rapidly evolving environment entails increasing operational investments which, over time, could weigh on the cost-to-income ratio. Despite the positive Q1 2026 results, shares have shown immediate signs of weakness on the stock exchange, reflecting growing "market caution" rather than simple fundamental weakness. When a stock reacts negatively to positive news, it often signals that the market has already priced in optimistic growth scenarios, making the asset vulnerable to potential corrections should future expectations not be met. Short 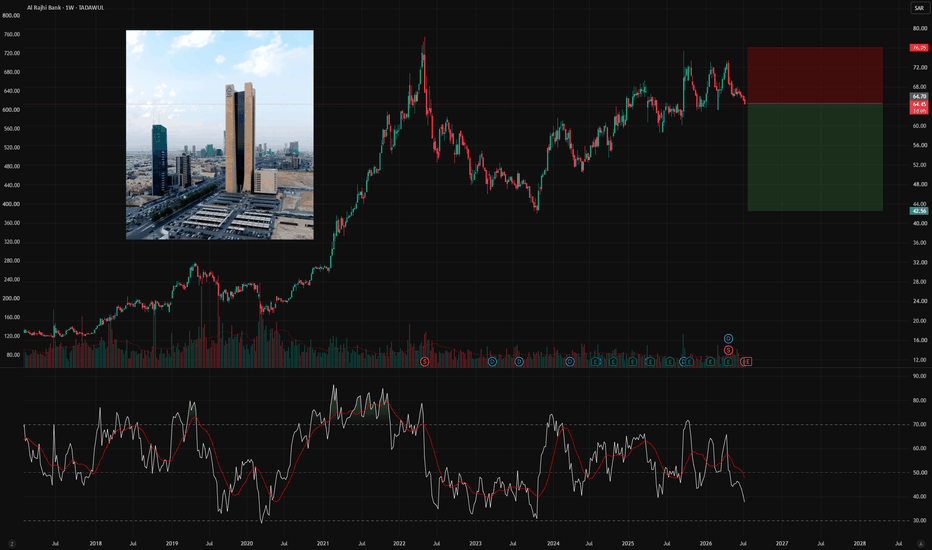
 Long
Long
 Long
Long