Alkhorayef Water & Power Technologies (2081) – Strong FundamentaAlkhorayef Water continues to deliver strong operational performance despite recent market weakness.
Fundamental Highlights
• Q1 2026 net profit increased 10.9% YoY, while EPS improved to SAR 1.84 versus SAR 1.66 in Q1 2025.
• FY2025 was another record year, with revenue reaching SAR 2.47B and net profit increasing to SAR 255.7M, reflecting consistent execution and long-term growth.
• During 2026, the company secured over SAR 1 billion in new operation & maintenance and infrastructure contracts. Most of these contracts span 30–60 months, providing strong earnings visibility and recurring cash flows.
• The company also continues to grow its Book Value Per Share, which increased from SAR 23.27 (Q1 2025) to SAR 28.04 (Q1 2026), while maintaining healthy profitability.
Technical View
The stock is approaching a major demand zone around SAR 100–105, where previous buying interest emerged.
Price action suggests the market is testing an important support area. A successful hold above this zone could trigger a recovery toward the SAR 130 resistance level.
Long-Term Outlook
If Alkhorayef continues executing projects efficiently, maintains its current profitability, and converts its growing contract pipeline into earnings, I believe the market could gradually re-rate the stock.
Potential price roadmap:
* Short-term target: SAR 130
* Medium-term target: SAR 150–175
* Long-term fair value: around SAR 220
* Bullish scenario (continued earnings growth and successful execution): SAR 240–260
These targets are based on continued earnings growth, strong ROE, expanding book value, recurring long-term contracts, and disciplined execution.  Long
Long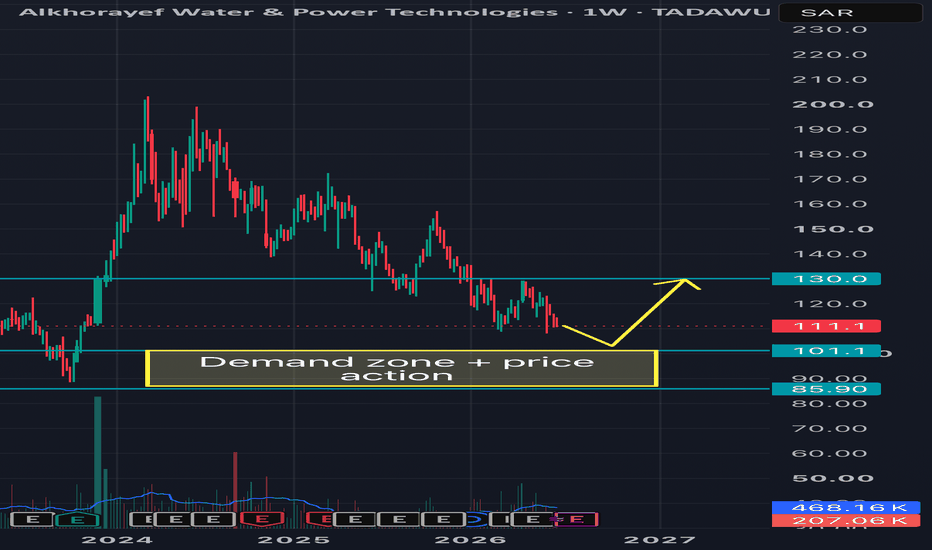
Rasan (8313): Watching a Confluence Support Zone Around 135Rasan is still trading inside an ascending channel even after the recent sharp drop.
Price is getting close to an interesting confluence zone around 135, where the lower boundary of the ascending channel, a previous support area, the 38.20% Fibonacci retracement. Increased chances of a positive reaction. I'm not in a hurry to enter, and would rather wait for a bullish candle. If the stock bounces from this zone, the next resistance level is 150 (Mid of the channel) and 160 as the top of the channel. A close below 124 would invalidate this setup.
Disclaimer:
The information provided is for educational and informational purposes only. It does not constitute financial or investment advice. Trading and investing in stocks involves risk, including the possible loss of capital. Any decisions to buy, sell, or hold securities are the sole responsibility of the reader. Past performance is not indicative of future results. Always do your own research and, if necessary, consult with a licensed financial advisor before making investment decisions.  Long
Long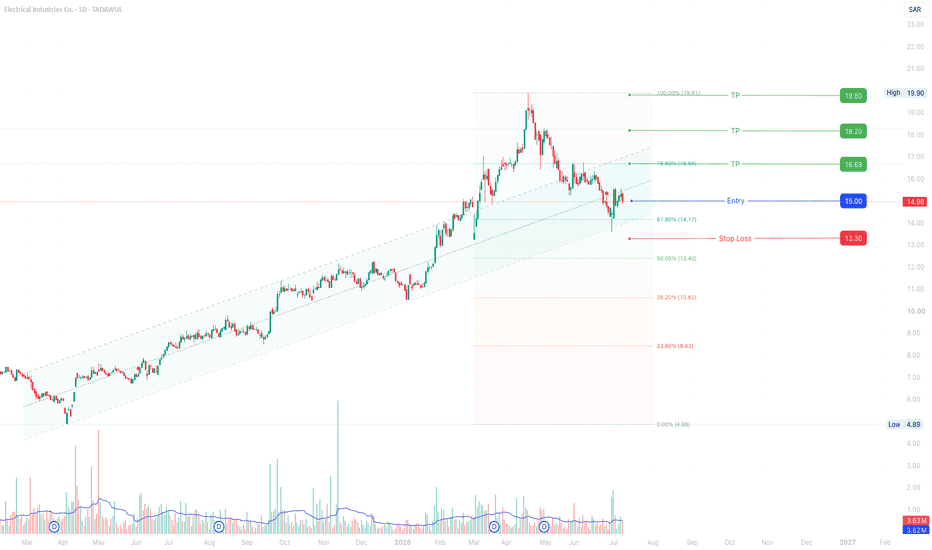
2120 Saudi Advanced Industries July 05, 2026Saudi Advanced Industries Co. — Daily Bullish Dealing Range Idea | July 05, 2026
Symbol: Saudi Advanced Industries Co. — Tadawul
Timeframe: Daily
Chart Date: July 05, 2026
Saudi Advanced Industries Co. has swept the 2025 low and then reacted back above that level. This is an important sign because price first collected sell-side liquidity, then started showing bullish strength again.
Now the daily timeframe has formed a bullish dealing range. Price is holding above the recent reaction area, and the structure is starting to look cleaner for a possible upside continuation. The yearly Type 4 FVG is also sitting below as a higher-timeframe imbalance, which adds more importance to this whole area.
My main idea is simple:
after the 2025 low sweep, if the daily dealing range stays valid and price continues to hold above it, the next draw on liquidity can be the upper imbalance / value area shown on the chart.
I am not interested in chasing the candle emotionally. I would prefer to see price respect the daily dealing range, maybe give a small pullback, and then continue with bullish displacement.
For confirmation, I want to see:
Daily dealing range holds
Price stays above the swept low
No strong bearish breakdown back into the lower range
Bullish candles continue from the reaction area
Upside movement toward the marked value / liquidity zone
This setup is interesting because the market has already taken downside liquidity and is now showing early signs of bullish delivery. If buyers continue to defend this dealing range, price can move higher toward the marked target zone.
Patience pays. Wait for confirmation, not emotions.  Long
Long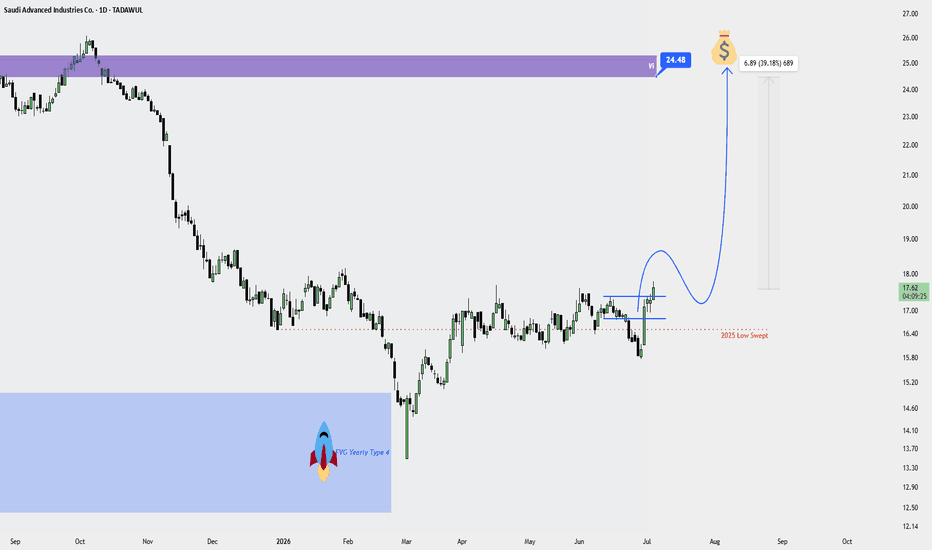
Dar Al Arkan Real Estate Daily Bullish Continuation Idea July
Dar Al Arkan Real Estate Development Co. — Daily Bullish Continuation Idea | July 05, 2026
Symbol: Dar Al Arkan Real Estate Development Co. — Tadawul
Timeframe: Daily
Chart Date: July 05, 2026
Dar Al Arkan is showing a clean bullish idea on the daily timeframe. Price has already reacted from the monthly FVG area and is now holding above that zone, which shows buyers are still defending the higher-timeframe imbalance.
The market spent time consolidating after the first bullish move, and now price is trying to push higher again. This type of structure can become interesting if the daily candles continue to hold above the monthly FVG and start showing stronger bullish displacement.
My main idea is simple:
as long as price respects the monthly FVG and does not break back aggressively below the recent support area, the next draw on liquidity can be the marked upside target zone.
I am not interested in entering blindly. I would prefer to see price hold this area, create a clean bullish reaction, and then continue toward the higher targets.
For confirmation, I want to see:
Price holds above the monthly FVG
Daily structure remains bullish
No strong breakdown below the recent support
Bullish displacement from the current range
Continuation toward the marked upside target
This is a patience-based setup. The monthly FVG has already acted as an important area, and now the main question is whether buyers can continue defending it.
Patience pays. Wait for confirmation, not emotions.  Long
Long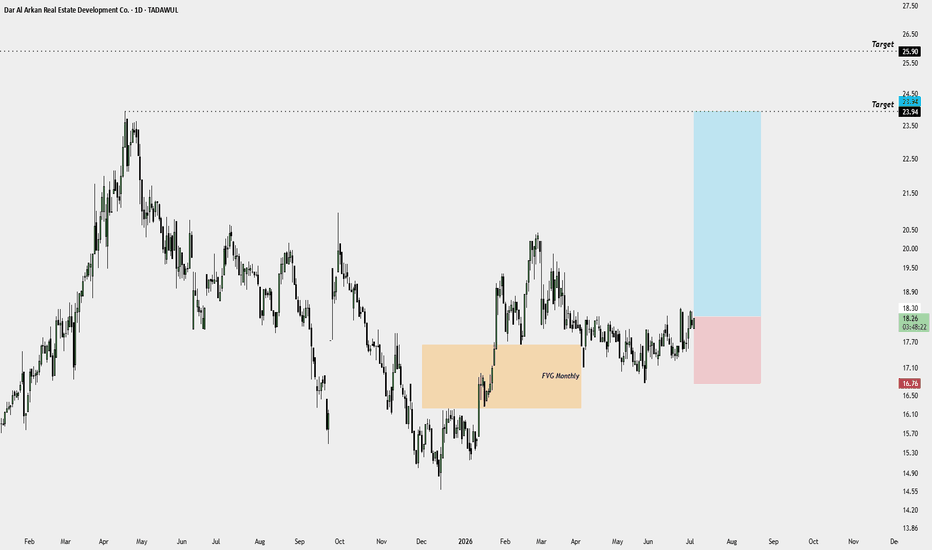
 Long
Long
 Long
Long
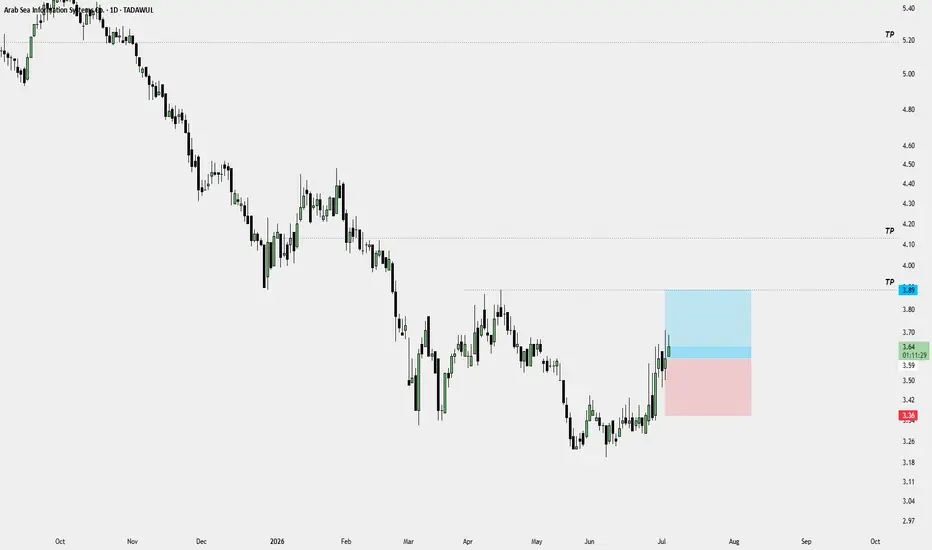
Arab Sea Information Systems Co. | July 05, 2026Arab Sea Information Systems Co. — Daily Bullish Continuation Idea | July 05, 2026
Symbol: Arab Sea Information Systems Co. — Tadawul
Timeframe: Daily
Chart Date: July 05, 2026
Arab Sea Information Systems Co. is showing a clean bullish recovery after a long bearish decline. Price has formed a base near the lower area and then moved up with strong bullish displacement, which shows that buyers are starting to take control on the daily timeframe.
Now price is holding near the current reaction zone, and the chart is showing a possible bullish continuation setup. The risk area is clearly defined below the current structure, while the upside has multiple marked TP levels.
My main idea is simple:
if price holds above the recent bullish range and does not break aggressively below the setup area, the next draw can be the first marked TP. After that, if momentum remains strong, the higher TP levels can come into focus.
I am not interested in chasing blindly. I want to see price respect the current range, hold above the recent support, and continue with clean bullish candles.
For confirmation, I want to see:
Price holds above the current bullish range
No strong breakdown below the risk zone
Daily candles continue showing bullish strength
Clean continuation toward the first TP
Higher targets only if momentum remains strong
This setup looks interesting because price has already shifted from weakness into a stronger recovery phase. Now the key is whether buyers can defend this daily structure.
Patience pays. Wait for confirmation, not emotions.  Long
Long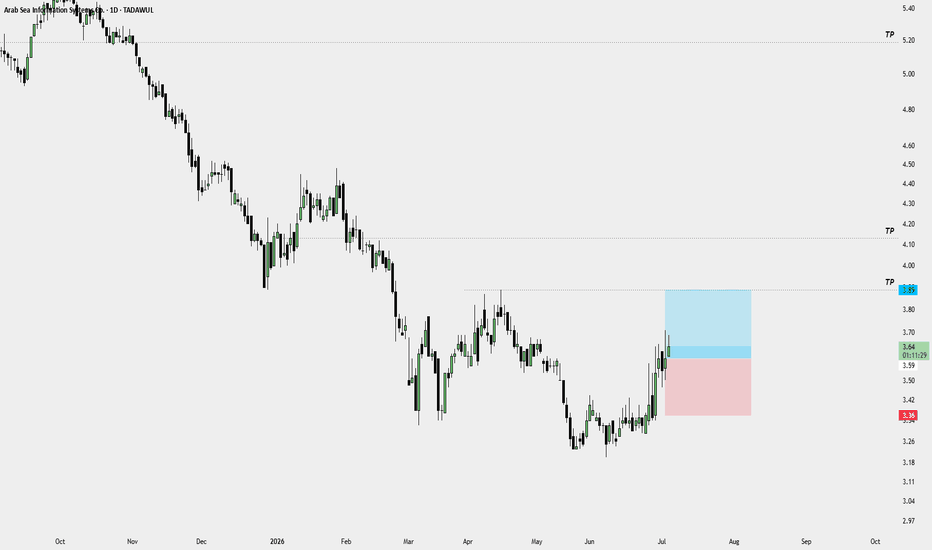
BinDawood Holding July 05, 2026BinDawood Holding Company — Daily Bullish Continuation Idea | July 05, 2026
Symbol: BinDawood Holding Company — Tadawul
Timeframe: Daily
Chart Date: July 05, 2026
BinDawood Holding Company is trading around an important monthly FVG Type 1 area. Price has already reacted from this higher-timeframe imbalance and is now trying to hold above it, which shows that buyers may still be defending this zone.
The daily structure is starting to look interesting because price is forming a small bullish reaction above the monthly FVG. If this area continues to hold, the next move can be a continuation toward the marked upside target.
My main idea is simple:
as long as price respects the monthly FVG and does not break aggressively below the invalidation area, I will look for a possible bullish continuation setup.
I am not interested in chasing the move blindly. I want to see price hold the current range, form a clean bullish reaction, and then continue with strength toward the target.
For confirmation, I want to see:
Price holds above the monthly FVG
Daily candles show bullish reaction
No strong breakdown below the setup area
Clean continuation from the current range
Move toward the marked TP / buy-side liquidity area
This is a patience-based idea. The setup is forming, but confirmation is still important. If buyers continue to defend the monthly FVG, BinDawood can move higher toward the next liquidity target.
Patience pays. Wait for confirmation, not emotions.  Long
Long
BAAN Holding Group Daily Bullish Dealing Range Idea July 2026BAAN Holding Group Company — Daily Bullish Dealing Range Idea | July 05, 2026
Symbol: BAAN Holding Group Company — Tadawul
Timeframe: Daily
Chart Date: July 05, 2026
BAAN Holding Group is showing a possible bullish setup on the daily timeframe. Price has recovered from the lower area and is now forming a cleaner bullish dealing range. The market is slowly building strength, and the recent price action shows buyers are trying to hold above the short-term reaction zone.
My main interest is after this daily timeframe dealing range has formed. I want to see price respect the lower imbalance / demand area and continue building bullish structure. If price holds this range and gives continuation, the next draw on liquidity can be the marked buy-side liquidity above.
The idea is simple:
price has already moved away from the sell-side liquidity zone, and now if the daily bullish dealing range remains valid, the market can continue toward the equal highs and later the potential higher target.
For confirmation, I want to see:
Price holds above the recent bullish reaction area
Daily candles continue respecting the dealing range
No aggressive breakdown below the setup
Bullish continuation toward buy-side liquidity
Clean reaction before entering, not chasing emotionally
This is a patience-based idea. The setup is interesting, but the entry must be clean. If the dealing range holds, BAAN can move toward the next liquidity objective. If price breaks back below the range with weakness, then the idea becomes invalid.
Patience pays. Confirmation is more important than prediction.  Long
Long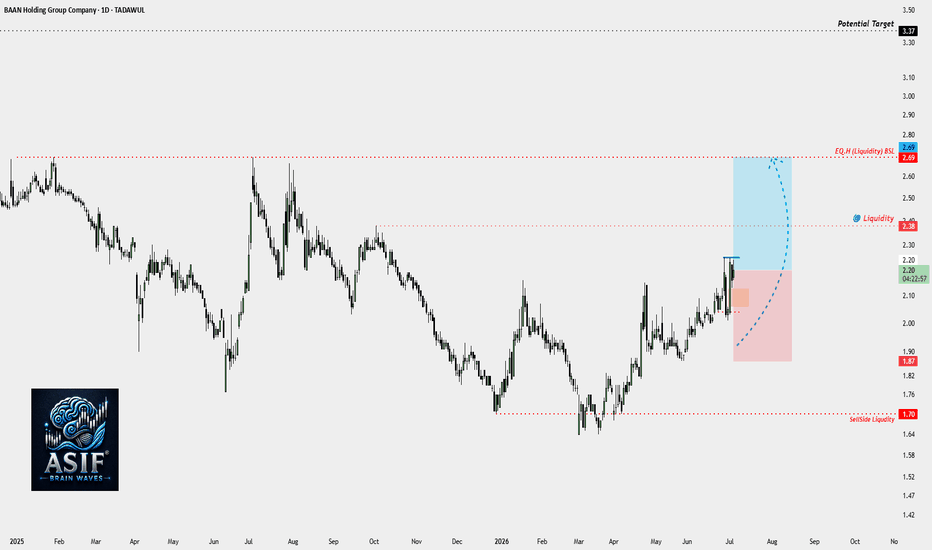
 Long
Long
 Long
Long
 Long
Long
 Long
Long
 Long
Long
 Long
Long
 Long
Long