6015 : Americana Here’s a detailed and polished overview of **Americana Restaurants International PLC (Ticker: 6015)**—presented clearly and in English, without links:
---
## 1. Stock Snapshot (as of Late August 2025)
* **Current Price**: Approximately **SAR 2.10**, down slightly from the previous close of **SAR 2.11**—a modest decline of around **0.5%**. The intra-day trading range spans **SAR 2.09 to 2.12**.
( , )
* **52-Week Range**: The stock has moved between **SAR 1.78** (low) and **SAR 2.90** (high), reflecting a pullback from its recent peak of nearly **SAR 2.90**.
( , )
---
## 2. Company Profile & Geographic Reach
* Americana Restaurants International PLC is a leading restaurant operator serving the Middle East and North Africa (MENA) region and Central Asia.
* It operates over **2,050 outlets** across 12 countries (including the UAE, Saudi Arabia, Kuwait, Egypt, Qatar, Jordan, Lebanon, Oman, Bahrain, Morocco, Iraq, Kazakhstan). Its concepts span quick service, casual dining, indulgence, coffee, and digital delivery channels.
* The company is headquartered in Sharjah, UAE, and employs approximately **38,226 people**.
( , )
---
## 3. Financial Performance & Valuation Metrics
* **Revenue** (Q2 ending June 2025): Around **USD 643.6 million**, bringing trailing 12-month revenue to approximately **USD 2.36 billion**, marking about **+6% year-over-year growth**. Fiscal 2024 saw a decline from prior years, with 2023 revenue at USD 2.41 billion and 2024 at USD 2.20 billion.
( )
* **Valuation Ratios**:
* **P/E Ratio (2025 estimate)**: \~22x
* **P/E Ratio (2026 estimate)**: \~18x
* **Enterprise Value to Sales**: \~1.97x (2025) → \~1.74x (2026)
( )
* **Dividend & Yield**:
* Recently paid a dividend of SAR 0.06 per share, yielding roughly **3–3.5%** depending on annual projection.
* Shares outstanding: \~8.4 billion; free float \~33.9%.
( , )
* According to another source, the trailing twelve-month dividend yield is about **2.71%**.
( )
---
## 4. Analyst Sentiment & Forecasts
* **Mixed to Positive Outlook**:
* JPMorgan has a **Buy** rating with a target near **SAR 3.02**, implying \~30% potential upside.
* Jefferies holds a **Hold** stance, targeting around **SAR 2.40**, indicating \~14% upside.
( , )
* **Local Brokerage Views**:
* United Securities reaffirmed its **Buy** rating.
* GIB Capital has an **Overweight** rating.
* AlJazira Capital downgraded to **Neutral**.
* Citi Bank continues with **Buy**.
( )
---
## 5. Strengths & Risks
### Strengths
* Significant **regional footprint** across the MENA and Central Asian regions.
* Offers a **diverse restaurant portfolio** (from drive-through to premium casual dining).
* Generates a decent **dividend yield** (\~3%).
* Demonstrates **renewed revenue growth** in recent quarters following a previous dip.
### Risks
* The stock is currently trading well below its one-year high and remains **down \~26% year-to-date**.
( , )
* Volatile profitability: 2024 profits declined sharply compared to previous years.
( , )
* Valuation appears relatively **rich compared to sector peers**, which may suggest lofty expectations.
( )
---
## Summary Table
| Category | Key Insights |
| ------------------- | ----------------------------------------------------------------------- |
| **Current Price** | \~SAR 2.10 (down \~0.5%) |
| **52-Week Range** | SAR 1.78 – SAR 2.90 |
| **Revenue (TTM)** | \~USD 2.36B (+6% YoY) |
| **Valuation** | P/E \~22x (2025), EV/Sales \~1.97x (2025) |
| **Dividend Yield** | \~3% |
| **Analyst Targets** | Range SAR 2.40 to SAR 3.02 (14%–30% upside) |
| **Strengths** | Regional presence, revenue growth, diversified business model |
| **Risks** | Declining past profitability, valuation premium, stock underperformance |
---
## Final Thoughts
Americana Restaurants (6015) presents an interesting opportunity in the regional hospitality sector. Its broad geographic reach, diverse dining formats, and recent improvement in revenue provide a compelling growth backdrop. Meanwhile, valuations and past financial volatility warrant caution. With mixed analyst ratings—ranging from Hold to Buy—it’s a stock where momentum may depend heavily on upcoming earnings results and execution consistency.
1304 – Al Yamama Steel IndustryAn investment opportunity is unfolding on Al Yamama Steel (Tadawul: 1304).
We are anticipating a potential 31% price appreciation within 4–5 months, targeting the 45.50 SAR zone.
🔑 Key Highlights:
Weekly & Monthly Bias → Bullish: Both higher timeframes are already aligned to the upside.
Daily CHoCH Confirmations: Multiple Change of Character signals show strength building after the recent correction.
Trendline Breakout: The downward trendline has been breached, suggesting momentum is shifting towards buyers.
Risk-to-Reward Ratio (RRR) → 3.45: Favorable setup with defined risk around 31.18 SAR and upside potential toward 45.50 SAR.
Projected Growth: ~31% in 4–5 months if the trade plays out as anticipated.
📊 Trade Setup:
Entry Zone: 34.40 – 38.20 SAR
Stop Loss: 31.18 SAR (-9.36%)
Target: 45.50 SAR (+31.6%)
RRR: 3.45
This trade is supported by a clear structure shift (BOS & CHoCH) on the daily chart, aligning with higher timeframe bullishness.
===============================
Our primary objective in the stock market is to grow our capital by 35–40% annually. To achieve this, we diversify our portfolio into 5–10 different securities. Profit targets are set on a monthly, quarterly, or half-yearly basis:
• Monthly: Close the position if it gains 10-15%.
• Within 2–3 months: Close if it gains 15-20%.
• Within 6 months: Close if it gains 20–30%.
This structured approach ensures consistent profit-taking while managing risk.
The real purpose of closing a position is to book profits and free up capital so it can be invested in better opportunities.
"For regular trading insights on Tadawul, make sure to follow us and stay ahead in the market."
2290 Bullish Wolfe WaveA clean bullish Wolfe Wave setup is emerging, with price action completing the fifth wave just outside the channel – a typical trap zone before reversal.
Wave 5 shows early signs of a bullish reaction, suggesting a potential move toward the target line drawn from points (1) to (4).
7040 | Etihad Atheeb TelecommunicationWe are not looking to jump in immediately — patience is key. The retracement around 102.5 SAR offers a favorable entry with a 3.95 Risk-to-Reward ratio. The protective stop loss is placed at 98.7 SAR.
The weekly bias remains bullish, supporting our long-term perspective on this move.
📌 Trade Plan
Entry: 102.5 SAR
Stop Loss: 98.7 SAR
Risk-to-Reward: 3.95
📈 Goals on Tadawul
+13% target within 3 months
+19% target within 6 months
This aligns with our broader Tadawul objectives — staying disciplined with high-quality entries, protecting downside risk, and keeping our eyes on steady, achievable growth milestones. Every trade setup we share contributes to building consistent, measurable progress toward our long-term Tadawul goals.
4070 – Tihama Advertising & Public Relations4070 – Tihama Advertising & Public Relations
Entry: 15.93 SAR
Target: 16.85 SAR (≈ 5% in 40 days)
Stop Loss: 15.62 SAR
Risk-Reward Ratio: ~3.0
Trend Analysis:
Weekly trend: Bearish
Monthly trend: Bearish
Current price action suggests we are in an accumulation zone, with the market likely to remain range-bound before any breakout.
Trade Outlook:
This is not an A+ quality setup — it carries higher risk. However, it still holds potential if executed carefully. For those willing to take the risk, ensure your entry is made on a retracement back to the 15.93 level to maintain favorable risk-reward.
7020 Etihad Etisalat Co.This stock deserves a spot in our portfolio. Although we missed a slightly better entry a few days ago that could have added around 2.5% extra, the current setup still offers strong potential.
Entry Zone: Current RR at 3.84 makes this a good entry.
Target: ~19% upside in the next 154 days.
Stop Loss: Well-defined at 5.21%.
Bias: Both weekly and monthly trends are bullish, confirming strength in momentum.
Everything looks aligned for Etihad Etisalat — a solid technical and fundamental setup to carry forward in our Tadawul portfolio.
=====================
Our primary objective in the stock market is to grow our capital by 35–40% annually. To achieve this, we diversify our portfolio into 5–10 different securities. Profit targets are set on a monthly, quarterly, or half-yearly basis:
• Monthly: Close the position if it gains 10-15%.
• Within 2–3 months: Close if it gains 15-20%.
• Within 6 months: Close if it gains 20–30%.
"For regular trading insights on Tadawul, make sure to follow us and stay ahead in the market."
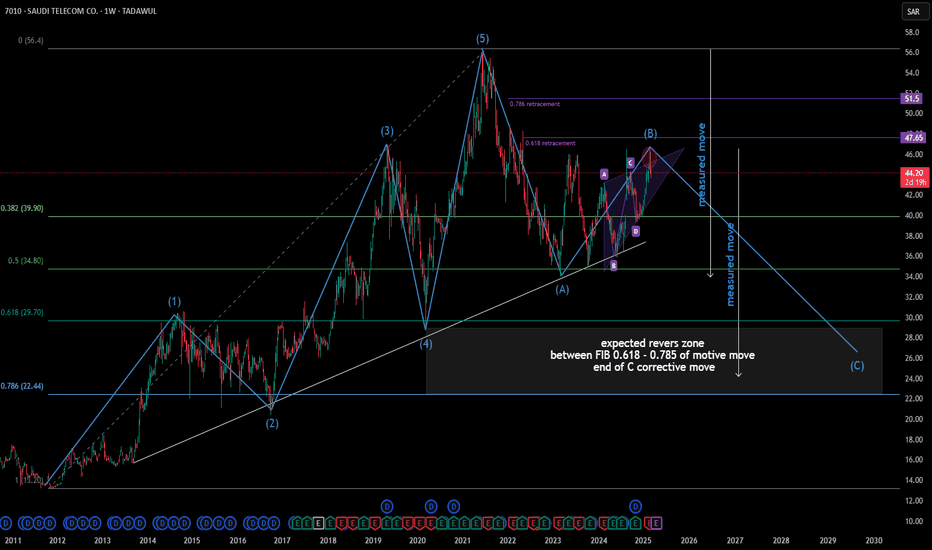
Tadawul Stock Opportunity – Saudi Telecom Co. (7010)Today, I’m sharing a potential swing setup on Saudi Telecom Co. (7010) with a Risk/Reward Ratio of 5.69 and an upside potential of 11.74% over the next two months.
Weekly Bias: Neutral
Monthly Bias: Bullish
Target: SAR 47.56 (approx. +11.74%)
Stop Loss: SAR 41.88 (approx. -1.97%)
Entry Zone: Marked on chart
Timeframe: Daily
The key zones have been carefully marked on the chart for both entry and target areas. The trade setup allows a tight stop compared to the target, giving us a favorable R:R profile.
📌 Chart Highlights:
Price path projection shows approx. 59 days to target if momentum holds.
Our primary objective in the stock market is to grow our capital by 35–40% annually. To achieve this, we diversify our portfolio into 5–10 different securities. Profit targets are set on a monthly, quarterly, or half-yearly basis:
• Monthly: Close the position if it gains 10-15%.
• Within 2–3 months: Close if it gains 15-20%.
• Within 6 months: Close if it gains 20–30%.
This structured approach ensures consistent profit-taking while managing risk.
The real purpose of closing a position is to book profits and free up capital so it can be invested in better opportunities.
💡 For more Tadawul insights, you can follow me. I will also share updates on whether to hold, reconsider, or close this position as the trade develops.
Tadawul Trade Update on 2010 (Saudi Basic Industries)Our goal for this trade is to achieve +15% within 90 days, perfectly aligning with our annual yield target.
⚠ Do not enter right away — wait for the daily candle to close bullish before taking a position.
Daily resistance has been broken, signaling bullish momentum.
Weekly chart structure is bullish, adding confidence to the setup.
We will monitor price action closely and update once an alert is triggered.
=========================================
Our primary objective in the stock market is to grow our capital by 35–40% annually. To achieve this, we diversify our portfolio into 5–10 different securities. Profit targets are set on a monthly, quarterly, or half-yearly basis:
• Monthly: Close the position if it gains 10-15%.
• Within 2–3 months: Close if it gains 15-20%.
• Within 6 months: Close if it gains 20–30%.
This structured approach ensures consistent profit-taking while managing risk.
The real purpose of closing a position is to book profits and free up capital so it can be invested in better opportunities.
"For regular trading insights on Tadawul, make sure to follow us and stay ahead in the market."
Leejam Sports Co. – TADAWUL | Swing Trade AlertWe’ve just received an alert for a beautiful swing setup on Leejam Sports Co. (TADAWUL).
From the current technicals, we can easily anticipate a 15% price rise within the next 3 months — a very healthy gain, especially if you’re aiming for a 35–40% annual yield.
Risk & Reward:
Target Gain: +15% (within ~3 months)
Risk: -4% potential downside
Risk/Reward Ratio: 4.43 — excellent!
The setup aligns perfectly with strong technical signals, making this an attractive opportunity for those following the Saudi Stock Exchange.
I’ll continue sharing more setups like this, InshAllah. Soon, I’ll also be publishing these opportunities on Notion, and the link will be shared here.
📌 Stay tuned and be ready to capitalize on these moments.
Buy Trade Plan — National Agricultural Development Co. (6010)Yes in the daily timeframe here, a Dealing Range (DR) is clearly formed.
Price created a recent swing low, then pushed up, broke short-term structure, and is now consolidating just above that breakout point. This DR acts as your context area for the bullish continuation toward the previous swing high around 28+.
So in simple terms:
HTF Bias: Bullish
Daily DR: Formed and holding
Buy Plan – Saudi Aramco (TADAWUL: 2222)**Buy Plan – Saudi Aramco (TADAWUL: 2222)**
Saudi Aramco is trading in a value zone, making it an attractive long-term buy. Price has formed a solid base and is showing early signs of reversal, with the next major target at the **buyside liquidity** around the 26.40 level.
**Plan:**
* **Entry Zone:** Accumulate within the 24.00 – 23.80 range if price dips, or on bullish confirmation above current levels.
* **Short-Term Target:** 25.50 (partial profit).
* **Main Target:** 26.40 (buyside liquidity).
* **Stop Loss:** Below 23.60 daily support.
* **Outlook:** Bullish for the coming months as market sentiment shifts and bears lose control. This setup favors swing traders and long-term investors aiming to capture the next bullish leg.
Patience here could reward with a clean breakout toward the upper liquidity zone.
Al Yamamah Steel – Buy Plan Al Yamamah Steel – Buy Plan 🚀
Entry:
Buy on confirmed breakout above the recent consolidation range.
Ideal entry if price retests the breakout level and holds strong.
Stop Loss:
Place stop loss just below the breakout zone to protect against false moves.
Targets:
First target at the next resistance level.
Final target at the previous major swing high for maximum potential gain.
Risk Management:
Risk only a small portion of total capital.
Add positions gradually if price continues to hold above the breakout zone.
Bias:
Price action suggests bullish continuation toward previous highs, with potential for extended rally if momentum remains strong.