Beautiful Bullish Divergence. 2080
Closed at 88.40 (18-12-2025)
Beautiful Bullish Divergence.
However, 88 - 91 is an immediate resistance,
if this resistance is crossed with Good volumes,
99 - 100 can be touched easily.
Monthly Closing above 88 - 89 would be a positive sign.
On the flip side, 80 - 82 may act as important Support.
However, breaking 79 may bring more selling pressure
towards 65 - 70.
HH/HL Pattern13-12-2025: CMP 121.7
4004 has recently started making HH/HL pattern.
price has retraced to previous HL (double bottom at 119.5)
either take very low isk entry at CMP or let it hit 119.5 and take support.
rebound from here can take it to 137, 155.
crossing and sustaing 157 will confirm the uptrend continuation
Seems to be around Important Support level.1833
Closed at 137.50 (08-12-2025)
Seems to be around Important Support level.
We may expect a bounce towards 140 -143 initially.
Crossing & Sustaining 140 - 141 may lead it towards 150+
On the flip side, breaking 134 may bring further selling pressure.
However, it is safe as long as it stays above 125
Beautiful Bullish Divergence appeared.2282
Closed at 56 (07-12-2025)
Beautiful Bullish Divergence appeared.
Immediate Resistance seems to be around 61 - 62
& then around 69 - 70.
Crossing & Sustaining this level may take the price
towards 100+
However, 49 should be the SL. if it is trigerred, we
may witness further selling pressure towards 30 - 31.
Buy Trade Setup Alamar Foods (4H)Buy Trade Setup — Alamar Foods (4H)
Price has reacted strongly from the lower range and formed a clear dealing range. The market is likely to reach up into the volume imbalance and higher FVG/imbalance levels.
Entry Zone: 42.40 – 42.90
Stop Loss: Below the recent swing low
Target 1: 45.50
Target 2: 47.80 – 48.00
The setup remains valid as long as price doesn’t close below the dealing range. Buyers are currently holding structure, suggesting room for further upside.
2020 IS ABOUT TO TEACH EVERYONE A LESSON HERE2020 has just started its bearish movement, so if you think you will recover by buying more shares YOU ARE WRONG, YOU ARE JUST PUTTING YOURSELF IN MORE LOSSES YOU CAN'T AFFORD.
As you see on the chart, the price grabbed the LQ and gave us a clean revesal in the level where I placed the circle, and now it is pushing down to grab the LQ at 112.6 to continue pushing lower.
So before you get stuck in more losses you sell everything and you wait for the price to give you a clear entry to take.
If you got any questions, don't hesitate to ask!
Follow for more so you don't miss any updates I'm posting!
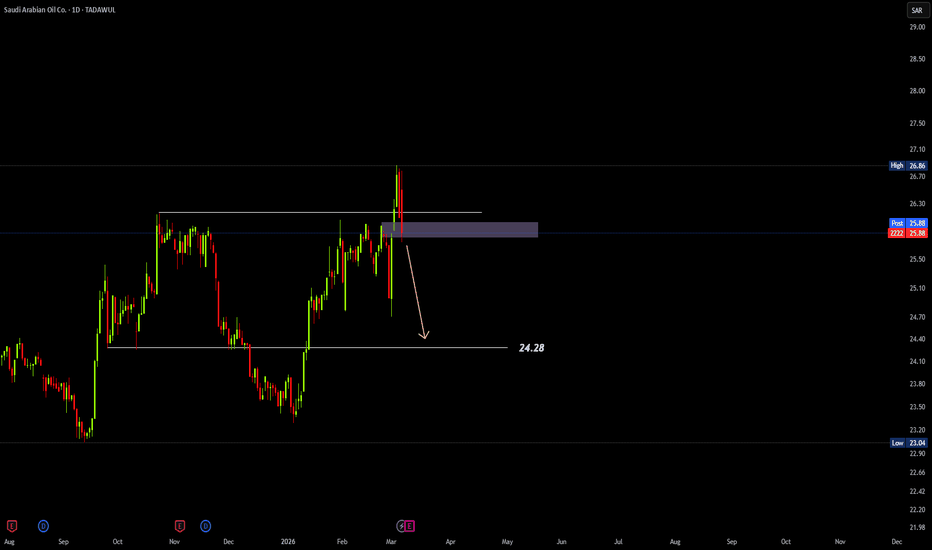
2222 IS STILL PUNISHING YOUAs you can notice on the chart, 2222 is still pushing lower, and you might be holding some shares on it while you're reading this.
As you can see on the chart, the price made a reversal at the point I placed a circle on after catching LQ and filling the gaps, now it is still pushing lower to reach 23.18 at least before coming higher again.
So for now YOU CANT BUY ARAMCO, and if you're holding any shares, you'd better sell while you're not in larger losses and wait for the price to give you a new entry point.
For any questions, don't hesitate to ask!
Follow for more.
1120 STOCK IS TAKING TAKING YOU TO BANKRUPCYAs you can see on the chart, the price is still pushing lower after the massive gap it made that caught everyone's eyes to buy.
NOW WHAT? YOU ARE IN LOSSES AND YOU WANT TO RECOVER!
YEs that's the case with all the traders who have bought on 1120, and I want to tell you that it's still crashing lower and lower to reach at least 90.15 before deciding what the next move is.
If you got any questions, don't hesitate to ask!
Follow for more.
1211 Technical, Geopolitical newsCombining your Elliott Wave analysis with the fundamental catalyst of the US-Saudi strategic cooperation creates an exceptionally strong, high-conviction bullish case for Ma'aden (1211).
🎯 Confirming the SAR 72 Target
The premise is:
Technical Indicator: Ma'aden (1211) is currently in the 5th (final) wave of a larger Elliott Wave impulse move.
Price Target: The calculated target for this wave is SAR 72.
Fundamental Catalyst: The MBS-signed US cooperation deal on energy/minerals provides the impetus to complete this 5th wave and potentially exceed it.
The SAR 72 target aligns strongly with the upper end of analyst estimates and recent technical observations, which cite the SAR 70 to SAR 80 range as a breakout potential.
🌊 The Elliott Wave Bullish Narrative for 1211
Under the Elliott Wave Principle, the 5th wave is the final leg in the direction of the main trend and is often the most emotionally driven and headline-fueled.
1. The Trigger for Wave 5: The Catalyst
The US-Saudi cooperation is the perfect news catalyst to initiate or dramatically accelerate the final 5th wave thrust:
Fundamental Justification: The deal validates Ma'aden's entire long-term strategy (Vision 2030 mining pillar) and adds a powerful Western ally/customer. This provides the fundamental reason for the final price surge.
Massive Volume: The news attracts large institutional capital (local and foreign), which provides the buying volume necessary to drive the stock through key resistance levels (the end of wave 4 correction).
2. The Mechanics of Wave 5 (Target SAR 72)
The Breakout: The price forcefully breaks past the high of Wave 3 and the key resistance area around the previous 52-week high (historically in the SAR 68.45 area based on recent data).
The Measure: Elliott Wave typically uses Fibonacci extensions to project Wave 5. The SAR 72 target is highly probable as it often corresponds to a 0.618 or 1.0 extension of the preceding waves. The momentum from the news helps guarantee this level is achieved.
Investor Psychology: The rally is fueled by FOMO (Fear of Missing Out). Investors who missed the earlier waves pile in, seeing a "globally strategic" stock suddenly given official US backing, ensuring the momentum carries the price to the final technical target.
2084 (Miahona Co.) – Technical OutlookPrice is moving sideways between two key zones:
• Resistance at 26.40–25.80
• Support at 22.20–21.60
It is currently sitting right on the horizontal support.
For any short-term buy, the first condition is a clean break of the downward trendline. Only then does the upside open back toward the 25.80–26.40 resistance zone. Until that break happens, the overall structure remains sideways.
A confirmed bullish trend requires a strong close above 26 with solid volume. Anything inside the box is just consolidation and range trading.
A bullish harmonic XABCD is also present, and price can still drift down toward the upward trendline, which may complete the D point. As long as the downward trendline holds, the bias leans bearish. Even if it breaks, the upside remains short-term capped at the top of the range.
Price has historically respected the FIB EMA 21 and EMA 20, and it is currently trading below both, adding more bearish weight. RSI is neutral — no divergence observed.
Fundamentally, the stock remains weak — negative EPS, gross profit, operating income, net profits, and cash flows in the previous quarter.
Update on 2382 Technical Analysis
TADAWUL:2382 Stop loss trailed to 15 (closing basis). Price action confirms a new higher high and higher low, marking the start of a potential bullish trend. Structure remains intact within the ascending channel, and a recent golden cross further strengthens the setup.
There’s mild bearish divergence on RSI, but it hasn’t translated into any real weakness yet. Bias stays bullish as long as price holds above the previous higher low — a close below it would be the first sign of short-term change in structure.