Long
Long
2001 Methanol Chemicals: Monthly Bullish Order Block ReactionGreetings, traders! 🌟 I’ve identified a compelling setup in the 2001 Methanol Chemicals market on the monthly chart. Join me as we explore the potential for a lucrative trade opportunity.
Analysis:
Bullish Order Block Identification: On the monthly timeframe, a clear bullish order block is developing in the 2001 Methanol Chemicals market. This zone typically signifies sustained buying interest and potential for upward movement.
Key Price Tab Reaction: Recently, there’s been a significant reaction at a specific price tab within this bullish order block. This reaction underscores the importance of this level, potentially serving as a strong support or resistance point.
Technical Confirmation: Technical indicators, including moving averages and RSI, are aligning with the bullish bias, suggesting favorable conditions for a potential uptrend continuation.
Trade Strategy:
Entry Point: Consider initiating long positions on a confirmed breakout above the recent reaction level, signaling renewed bullish momentum.
Stop-loss Placement: Implement a stop-loss below the lowest point of the bullish order block to manage risk effectively and protect capital.
Profit Targets: Target potential upside based on Fibonacci extensions or significant historical resistance levels. Refer to the attached chart for precise target levels.
Risk Management:
Risk-Reward Ratio: Maintain a balanced risk-reward ratio to ensure that potential gains justify the risks taken in the trade.
Position Sizing: Adjust position sizes based on your risk tolerance and account size, adhering to sound risk management principles.
Conclusion:
This setup in 2001 Methanol Chemicals presents a promising opportunity based on the bullish order block and recent price tab reaction. As always, exercise caution and follow your trading plan diligently.
Chart Targets: Refer to the attached chart for specific profit targets marked with Fibonacci levels and historical resistance points.
Disclaimer: This is not financial advice. Please conduct your own research or consult a financial advisor before making any investment decisions.  Long
Long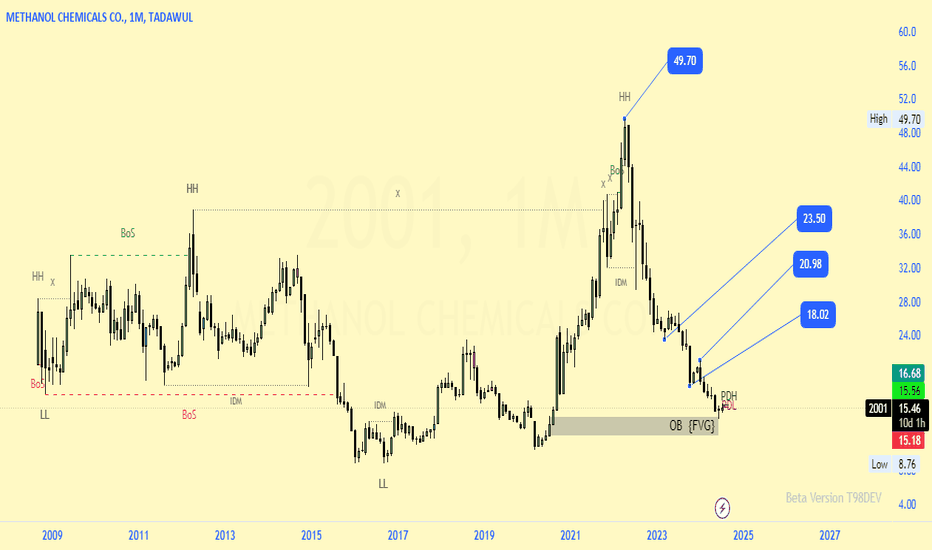
 Long
Long
 Long
Long
 Long
Long
Weekly RSI MACD Fibonacci//@version=5
indicator("Weekly RSI MACD Fibonacci", overlay=true)
// Get the weekly data
symbol = syminfo.tickerid
weekly_close = request.security(symbol, "W", close)
// RSI Calculation
rsi_length = input.int(14, title="RSI Length")
rsi_overbought = input.int(70, title="RSI Overbought Level")
rsi_oversold = input.int(30, title="RSI Oversold Level")
rsi = ta.rsi(weekly_close, rsi_length)
// MACD Calculation
macd_length_short = input.int(12, title="MACD Short Length")
macd_length_long = input.int(26, title="MACD Long Length")
macd_signal_smoothing = input.int(9, title="MACD Signal Smoothing")
= ta.macd(weekly_close, macd_length_short, macd_length_long, macd_signal_smoothing)
macd_histogram = macd_line - signal_line
// Fibonacci Levels
var float fib_high = na
var float fib_low = na
var float fib_0 = na
var float fib_0_382 = na
var float fib_0_5 = na
var float fib_0_618 = na
var float fib_1 = na
if (na(fib_high) or weekly_close > fib_high)
fib_high := weekly_close
if (na(fib_low) or weekly_close < fib_low)
fib_low := weekly_close
fib_0 := fib_low
fib_1 := fib_high
fib_0_382 := fib_0 + (fib_1 - fib_0) * 0.382
fib_0_5 := fib_0 + (fib_1 - fib_0) * 0.5
fib_0_618 := fib_0 + (fib_1 - fib_0) * 0.618
// Plot RSI
hline(rsi_overbought, "RSI Overbought", color=color.red)
hline(rsi_oversold, "RSI Oversold", color=color.green)
plot(rsi, "RSI", color=color.blue)
// Plot MACD
hline(0, "Zero Line", color=color.gray)
plot(macd_line, "MACD Line", color=color.red)
plot(signal_line, "Signal Line", color=color.blue)
plot(macd_histogram, "Histogram", color=color.green, style=plot.style_histogram)
// Plot Fibonacci Levels
plot(fib_0, "Fib 0%", color=color.red, linewidth=2)
plot(fib_0_382, "Fib 38.2%", color=color.orange, linewidth=2)
plot(fib_0_5, "Fib 50%", color=color.yellow, linewidth=2)
plot(fib_0_618, "Fib 61.8%", color=color.green, linewidth=2)
plot(fib_1, "Fib 100%", color=color.blue, linewidth=2)
 Long
Long
 Long
Long
 Long
Long
 Long
Long
 Long
Long
 Long
Long
 Long
Long
 Long
Long
 Long
Long
 Long
Long