• Products
  • Community
  • Markets
  • Brokers
  • More
Get started
  • Markets
  • /Saudi Arabia
  • /Stocks
  • /Ideas
1182 IS STILL GOING LOWER As you can notice on the chart, 1182 is still going in a bearish trend to reach at least 11.36 before it starts creating an entry to take, for now don't buy it since it will continue dropping down. In few days I will share with you the trades I gave to my clients! Follow for more!
TADAWUL:1182Short
by YassineAnalysis
Bearish Setup on United Electronics Co TADAWUL Weekly TimeframeStructure & Market Behavior: The market made a strong bullish move from the green highlighted zone labeled as "unmitigated order flow", pushing up with a clear Break of Structure (BoS) on the left side. A strong rally continued until it peaked (highlighted by the blue dot). After the peak, the price dropped, creating a Lower High (LH) and Lower Low (LL) structure, suggesting a bearish shift. Key Elements Marked: Order Block (OB): A bearish OB is marked on the right side near the current price
TADAWUL:4003Short
by Asif_Brain_Waves
RIYAD BANK - Weekly Chart (TADAWUL)RIYAD BANK - Weekly Chart (TADAWUL) Current Price: Around 30.60 Target Price: 42.90 (marked with a heart 💗 at the top) Plan: Price may first drop a little (towards 27–28 zone), then move up strongly toward the target (42.90). Important Zones: FVG: Areas where price may bounce or react. OB (Order Block): A strong resistance zone. Change in Status: A possible support area where the trend might change. Overall Idea: The chart shows a possible move down first, then a big upward move toward the 42.90
TADAWUL:1010Long
by Asif_Brain_Waves
SAUDI AWWAL BANK | Weekly Timeframe (TADAWUL)Chart Analysis – SAUDI AWWAL BANK | Weekly Timeframe (TADAWUL) Key Areas Highlighted: Equal Highs (Buy-Side Liquidity): Marked at the top (around 46.50), indicating a liquidity pool where institutions might target to grab stop-losses above these highs. Target Price: 42.65 is marked as a significant level where price is expected to move next (short-term target). FVG (Fair Value Gap - Monthly): A green zone around the 33-36 range indicates an area of imbalance that price might fill before cont
TADAWUL:1060Long
by Asif_Brain_Waves
Gulf Insurance Group - Tadawul (Weekly Timeframe):Trade Idea: Demand Zone Reversal Play Market Structure: Price has broken the ascending trendline and entered a bearish order block (marked in red). A short-term bearish move is expected. Expected Move: Price may drop toward the Demand Zone (21.70–23.28) before a potential bullish reversal. Key Levels: 📉 Support (Demand Zone): 21.70–23.28 📈 Potential Upside Target: 27.00 (first target), continuation possible if momentum builds Narrative: After the breakdown from the Order Block and trendline, pri
TADAWUL:8250
by Asif_Brain_Waves
2360: False Breakdown at Support levels!On the weekly chart, a divergence has formed, while the daily chart shows a false breakdown.
TADAWUL:2360Long
by Scavenger4TheGem
Bullish Bounce on 2081 TASI Retest Weekly FVG with good big candle enter with FVG 1H Target 2RR
TADAWUL:2081Long
by K_M_M
Updated
Bearish Divergence on Monthly TF but Bounce ExpectedBearish Divergence on Monthly TF. Very important Support lies around 160 - 162; and a Bounce is Expected if this level is Sustained on Monthly Support. Bullish Divergence on Short TF; so a bounce can be seen up to 177 & then 194 (if 177 is Sustained)
TADAWUL:4210
by House-of-Technicals
Updated
1
Fawaz Abdulaziz Al Hokair Co 4240 January 2025Trading Setup Overview Break of Structure (BOS): A strong move upward has likely broken a key structural resistance level. Target: Equal highs (liquidity zones) are present above, which might act as magnets for price. Bias: Keep this idea in view for a short-term bullish continuation unless a reversal pattern forms.
TADAWUL:4240Long
by Asif_Brain_Waves
Updated
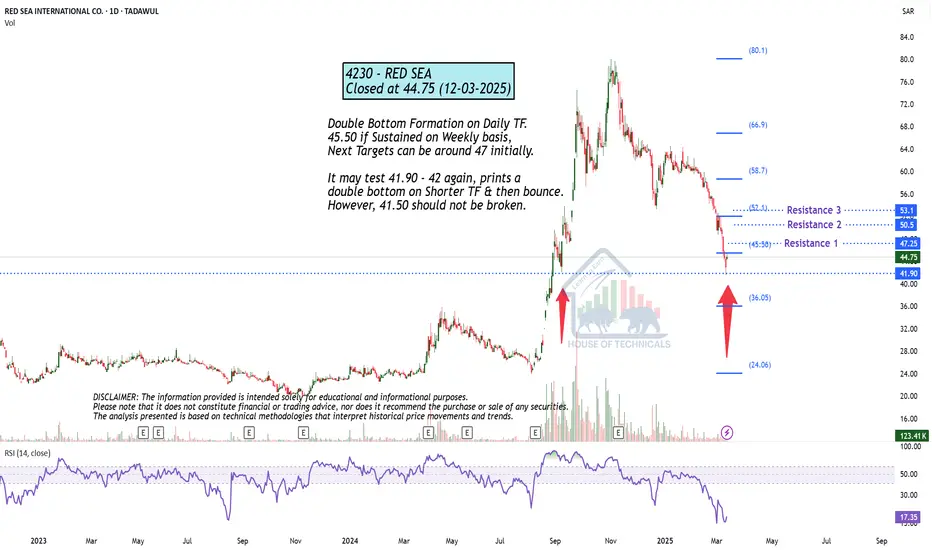
@ Important Support LevelDouble Bottom Formation on Daily TF. 45.50 if Sustained on Weekly basis, Next Targets can be around 47 initially. It may test 41.90 - 42 again, prints a double bottom on Shorter TF & then bounce. However, 41.50 should not be broken.
TADAWUL:4230
by House-of-Technicals
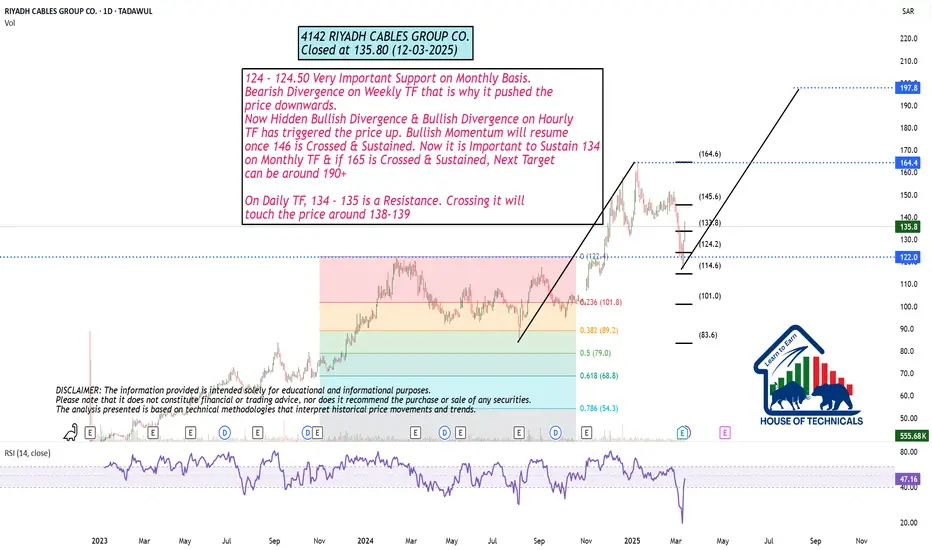
Play on Levels124 - 124.50 Very Important Support on Monthly Basis. Bearish Divergence on Weekly TF that is why it pushed the price downwards. Now Hidden Bullish Divergence & Bullish Divergence on Hourly TF has triggered the price up. Bullish Momentum will resume once 146 is Crossed & Sustained. Now it is Important to Sustain 134 on Monthly TF & if 165 is Crossed & Sustained, Next Target can be around 190+ On Daily TF, 134 - 135 is a Resistance. Crossing it will touch the price around 138-139
TADAWUL:4142
by House-of-Technicals
6015 IS ABOUT TO GIVE US AN ENTRY TO TAKECouple days ago, I posted that 6015 will come lower to 2.14, if you listened and followed my advice and closed your positions, congrats! But if you don't and you kept holding, I hope you didn't lose too much of your funds. For now there's no clear entry to take, we'll keep waiting for the price to give us a proper entry to follow, which I will post a bit late, 2/3d after I share it to my clients so you can see how it goes. Follow for more!
TADAWUL:6015Long
by YassineAnalysis
1
3092 IS GOING BEARISHWhile searching for some trades for my clients to buy, I found this on RIYADH CEMENT tn which the price is giving a reversal point in which it will go at least to 29.75. If you're holding any profitable shares, you'd better close and enjoy your profits! Follow for more!
TADAWUL:3092Short
by YassineAnalysis
Bullish on 2382 ADES TASI Fake breakout on 1H and close daily above Monthly level (orange line) Wait for retest and target 17.18 price level
TADAWUL:2382Long
by K_M_M
Updated
Wait for retrace on 7020 MOBILY TASI Wait for retrace to test old high + Weekly FVG Then looking for entry
TADAWUL:7020
by K_M_M
Currently in Bearish Trend. Currently in Bearish Trend. H&S Pattern in play targeting around 40ish. Weekly Closing above 70 may be a Positive sign. However, if the selling pressure continuous, we may witness 67 & then 63. In my view, it should test 74 - 75 once before going down (if it has to). Important Resistance is around 75 - 76. Important Supports are 67 - 69 & then around 63. One positive sign is that there is a double Bullish Divergence on Shorter Time Frames. If it plays now, we may see 73 - 75 (which is again a
TADAWUL:4163
by House-of-Technicals
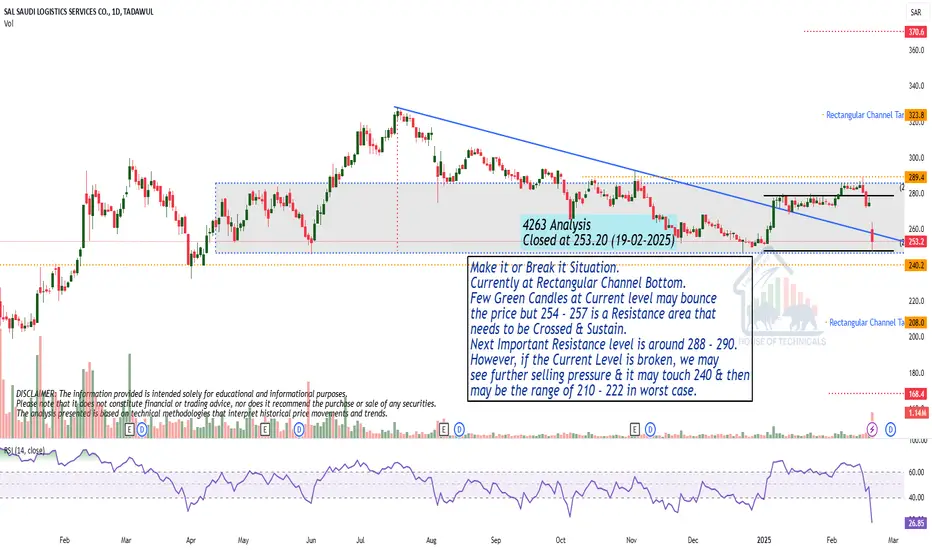
Make it or Break it Situation. Currently at Rectangular Channel Bottom. Few Green Candles at Current level may bounce the price but 254 - 257 is a Resistance area that needs to be Crossed & Sustain. Next Important Resistance level is around 288 - 290. However, if the Current Level is broken, we may see further selling pressure & it may touch 240 & then may be the range of 210 - 222 in worst case.
TADAWUL:4263
by House-of-Technicals
Updated
#4031 SAUDI GROUND SERVICES CO.Trading the stock below 57 is not good, The continuation of momentum in the downward leg means taking this path.
TADAWUL:4031
by Hlk_7
Americana Restaurants International PLC ### **Key Observations:** 1. **Sell-Side Liquidity (SSL) Taken:** - The price has previously swept the **sell-side liquidity** (lower stop orders), indicating a potential **reversal or accumulation phase**. 2. **Fair Value Gap (FVG) Overlapping:** - A **bullish FVG** is visible, meaning that price might revisit this area as part of a retracement before continuing upward. 3. **Internal Liquidity Target:** - The first **internal range liquidity (IRL)** target is around **
TADAWUL:6015Long
by Asif_Brain_Waves
Morning Star formation on Daily TF but..Morning Star formation on Daily TF. Monthly Closing above 29 would be a Positive Sign. However, 28 - 29 can be a Good Support Zone. 28.50 should not be broken, otherwise further Selling Pressure can be witnessed. On the flip side, 32 - 32.50 is an Important Resistance. However, only Morning Star formation is not enough, because it is currently at Strong Resistance around 32 - 32.5, so let it sustain this level. Sustaining this level may give 2-4 riyals gain.
TADAWUL:2190
by House-of-Technicals
NOT A GOOD TIME TO BUY 4007If you have a look at the chart, you'll see that the price started going higher and higher since Dec 2024, grabbed the liquidities we have at 41.80 and 44.35, to give us a confirmation of a reversal right on the liquidity at 44.35. Today the price grabbed the LQ we have at 41.80, and it will keep pushing down to 37.90 before giving us an entry to take. For now, if you still haven't bought, you just wait. And if you already holding any shares, you can tell me in the comment section your entry
TADAWUL:4007Short
by YassineAnalysis
6015 IS STILL GOING BEARISH DONT BUYAs you can notice on the chart, the price is still pushing bearish since Sept 2023 where it gave us the ATH. In Jan 2025, it did a quick jump towards the LQ to grab it, and now ir is coming down towards the LQ level at 2.14, the least point we'll expect the price to reach is 2.19 where we have our OB. Anything that than is just a wish. NB: I follow the things I have in front of me on the chart combined with the Fundamentals. So please if you have any other POV you can discuss it politely.
TADAWUL:6015Short
by YassineAnalysis
aramco 03-march-2025dear investors and traders we see market was in down trend since december 2024 price now reach a very strong support and i recommand you to buy this action when he reach 26.90$ next correction will be at 27.55$ its 2.31% see u later [
TADAWUL:2222Long
by oualid95
ELM (TADAWUL: 7203) - Double Bottom Breakout SetupThe price action on the 4-hour chart of ELM CO (TADAWUL) has formed a double bottom pattern, signaling a potential bullish reversal. Trade Idea: A breakout above 1115.0 confirms the double bottom pattern. Risk management is crucial – placing SL below bottom at 1048 to ensures controlled risk. Key Levels: Neckline Breakout: 1115.0 (Entry Point) TP1: 1182.0 TP2: 1249.0 Stop Loss : 1048
TADAWUL:7203Long
by m_ranwar
123456789101112131415161718192021222324252627282930313233343536373839404142
…999

Made by humans

Select market data provided by ICE Data Services. Select reference data provided by FactSet. Copyright © 2026 FactSet Research Systems Inc.Copyright © 2026, American Bankers Association. CUSIP Database provided by FactSet Research Systems Inc. All rights reserved. SEC filings and other documents provided by Quartr.© 2026 TradingView, Inc.

SOC 2 CompliantGDPR Compliant
More than a product
  • Supercharts
Screeners
  • Stocks
  • ETFs
  • Bonds
  • Crypto coins
  • CEX pairs
  • DEX pairs
  • Pine
Heatmaps
  • Stocks
  • ETFs
  • Crypto coins
Calendars
  • Economic
  • Earnings
  • Dividends
  • IPOs
More products
  • News Flow
  • Portfolios
  • Fundamental Graphs
  • Yield Curves
  • Options
  • Macro Maps
  • Pine Script®
  • MCP Server
Apps
  • Mobile
  • Desktop
Community
  • Social network
  • Wall of Love
  • Refer a friend
  • Creator program
  • House Rules
  • Moderators
Ideas
  • Trading
  • Education
  • Editors' picks
Pine Script
  • Indicators & strategies
  • Wizards
  • Freelancers
  • Marketplace
Tools & subscriptions
  • Features
  • Pricing
  • Market data
  • Gift plans
Trading
  • Overview
  • Brokers
  • Brokers comparison
  • The Leap
Special offers
  • CME Group futures
  • Eurex futures
  • US stocks bundle
About company
  • Who we are
  • Space mission
  • Blog
  • Help Center
  • Careers
  • Media kit
Merch
  • Tarot cards for traders
  • The C63 TradeTime
Policies & security
  • Terms of Use
  • Disclaimer
  • Privacy Policy
  • Cookies Policy
  • Accessibility Statement
  • Trust Center
  • Security tips
  • Bug Bounty program
  • Status page
Business solutions
  • Widgets
  • Charting libraries
  • Lightweight Charts™
  • Advanced Charts
  • Trading Platform
Growth opportunities
  • Advertising
  • Brokerage integration
  • Partner program
  • Education program
Community
  • Social network
  • Wall of Love
  • Refer a friend
  • Creator program
  • House Rules
  • Moderators
Ideas
  • Trading
  • Education
  • Editors' picks
Pine Script
  • Indicators & strategies
  • Wizards
  • Freelancers
  • Marketplace
Business solutions
  • Widgets
  • Charting libraries
  • Lightweight Charts™
  • Advanced Charts
  • Trading Platform
Growth opportunities
  • Advertising
  • Brokerage integration
  • Partner program
  • Education program
Look FirstLook First