 Long
Long
 Long
Long
 Long
Long
 Long
Long
Al Munajem Foods : Slow & SteadyTADAWUL:4162
📈 Slow & Steady Climb Toward a Weekly Breakout — Is the Next Major Rally Approaching? 🇸🇦
The weekly chart continues to paint a constructive bullish picture, with price steadily advancing toward a major breakout zone. Unlike explosive rallies, this gradual ascent reflects healthy accumulation, often laying the groundwork for a stronger and more sustainable uptrend.
The key now is confirmation above resistance.
🔍 Technical Outlook
The 67 price level is the most important resistance on the chart.
A weekly close above 67, followed by sustained trading above this level, would confirm a breakout and significantly improve the probability of a fresh bullish expansion.
This breakout could mark the transition from accumulation to trend continuation.
⚠️ Buy-the-Dip Opportunity
If the breakout is delayed and the stock undergoes a healthy correction, the 55 support zone becomes the area to watch.
Historically, this level has acted as a strong reversal and demand zone, attracting buyers during previous pullbacks.
A successful retest of 55 would keep the long-term bullish structure intact while offering a more attractive risk-to-reward entry.
🎯 Profit-Taking Zones
Once the stock confirms a breakout above 67, the first upside objectives are:
🎯 Target 1: 76
🎯 Target 2: 90
These levels represent the next major resistance zones where traders may consider partial profit-taking.
🚀 Extended Bullish Targets
If momentum remains strong and the weekly trend continues to print Higher Highs and Higher Lows, the next Fibonacci and structural targets come into focus:
🚀 118
🚀 135
🚀 150
🚀 163
These extended targets become increasingly probable only if price maintains its bullish market structure and breakout momentum.
📊 My View
The stock is quietly building strength, and sometimes those are the setups that deliver the biggest moves.
✅ Slow and steady weekly accumulation.
✅ 67 remains the key breakout confirmation level.
✅ 55 is the ideal demand zone if a healthy pullback develops.
✅ Initial targets: 76 → 90.
✅ Long-term bullish roadmap: 118 → 135 → 150 → 163.
Patience pays. Waiting for a confirmed breakout above 67 or a disciplined buy near 55 could offer the best risk-to-reward opportunity.
Do you expect the stock to break above 67 on the first attempt, or will it revisit 55 before launching its next major rally? Share your technical view below! 👇
⚠️ Financial Disclaimer
Disclaimer: This analysis is provided for educational and informational purposes only and should not be considered financial, investment, or trading advice. Always conduct your own research (DYOR) and apply disciplined risk management before making any investment decisions.
#Tadawul #SaudiStockMarket #SaudiStocks #TASI #SaudiInvesting #SaudiTrading #SaudiInvestors #KSAStocks #SaudiEquities #RiyadhMarket #GCCMarkets #MiddleEastMarkets
#TechnicalAnalysis #TradingView #PriceAction #WeeklyChart #Breakout #TrendFollowing #MarketStructure #HigherHigh #HigherLow #SupportAndResistance #SwingTrading #MomentumTrading #BreakoutTrading #ChartAnalysis #StockAnalysis #TradingIdeas #LongTermInvesting #BullishSetup #RiskManagement #Fibonacci
#WiSHFundManagement  Long
Long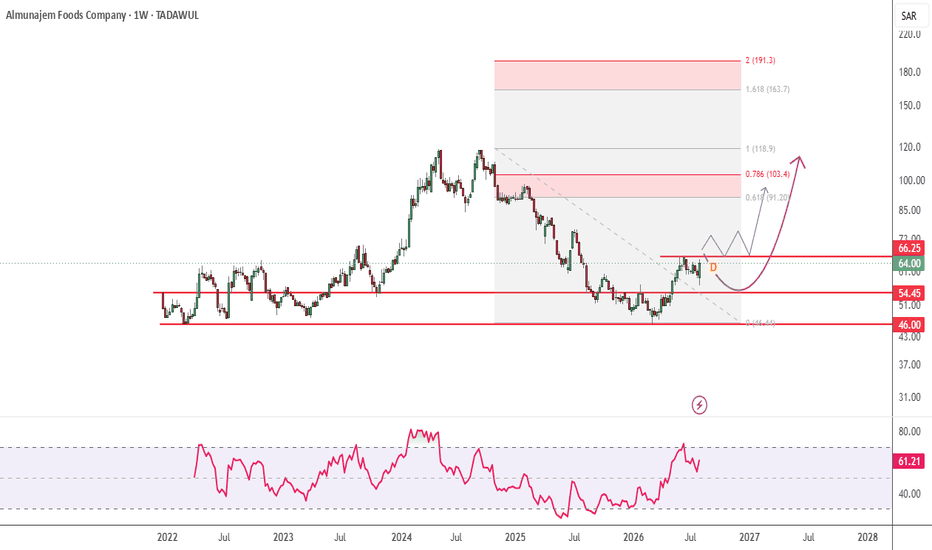
Saudi Public Transport : Rounding Off Bottom for UpsideTADAWUL:4040
🚀 Breakout Loading? Bulls Eyeing 18–24 as Momentum Builds 🇸🇦
The stock has staged an impressive recovery on the daily timeframe, rallying from 10.40 to test the 12.30–12.40 resistance zone. At the same time, the RSI has surged from 38 to nearly 70, highlighting strong bullish momentum—but also signaling that the move may need to cool off before the next leg higher.
This is a classic "consolidation or correction" scenario that traders should watch closely.
🔍 Technical Outlook
Price is currently trading within a well-defined range between:
📍 Support: 10.40
📍 Resistance: 12.40
The blue trendline on the chart highlights the potential breakout path. A decisive move above this range could confirm the continuation of the current bullish trend.
📈 Bullish Scenario
The ideal setup would be for price to consolidate beneath resistance, allowing the RSI to cool off while maintaining the current range.
This type of healthy consolidation often resets momentum and provides a stronger foundation for the next breakout.
A confirmed breakout followed by a successful retest of the 12.40 resistance would significantly strengthen the bullish outlook.
🎯 Breakout Targets
If buyers reclaim the breakout level with strong volume and momentum, the next upside objectives become:
🎯 Target 1: 18/20
🎯 Target 2: 24
🚀 Extended Target: 34
These levels represent the next major Fibonacci and structural resistance zones where traders should monitor price action.
⚠️ Alternative Scenario
If price fails to consolidate and momentum fades, a healthy correction should not be ruled out.
Key support levels to watch:
🛡️ 10.40 – Primary demand zone.
🛡️ 9.50 – Strong confluence support, aligning closely with the 0.618 Fibonacci retracement of the latest bullish swing.
A controlled pullback into these areas could offer a more favorable risk-to-reward accumulation opportunity, provided bullish price action returns.
📊 My View
The trend remains constructive, but patience is the edge.
✅ Strong momentum with RSI rising from 38 to 70.
✅ Healthy consolidation above 10.40 would be more bullish than an immediate breakout.
✅ Breakout + retest above 12.40 would confirm the next leg higher.
✅ Upside targets remain 18/20 → 24 → 34, while 10.40–9.50 serves as the key support zone if a correction develops.
Sometimes the strongest rallies begin after a period of quiet consolidation. Let the market confirm the breakout before chasing momentum.
Do you expect a breakout from this range, or will the stock first revisit support to build a stronger base? Share your technical view below! 👇
⚠️ Financial Disclaimer
Disclaimer: This analysis is for educational and informational purposes only and should not be considered financial, investment, or trading advice. Always conduct your own research (DYOR) and practice disciplined risk management before making investment decisions.
#Tadawul #SaudiStockMarket #SaudiStocks #TASI #SaudiInvesting #SaudiTrading #SaudiInvestors #KSAStocks #SaudiEquities #MiddleEastMarkets #GCCMarkets
#TechnicalAnalysis #TradingView #PriceAction #Breakout #BreakoutRetest #RSI #MomentumTrading #Consolidation #MarketStructure #Fibonacci #SupportAndResistance #SwingTrading #TrendFollowing #ChartAnalysis #TradingIdeas #BullishSetup #StockAnalysis #RiskManagement #Investing #BuyTheDip
#WiSHFundManagement  Long
Long
ACWA Power 2082After a significant correction from its all-time high, ACWA Power appears to be entering a base-building phase rather than continuing its previous downtrend.
Fundamental View
The latest financial results continue to reflect a company investing for long-term growth rather than maximizing short-term earnings.
Key observations:
* Book Value Per Share continues to improve, indicating stronger shareholders’ equity.
* EBITDA remains resilient despite the recent moderation in profitability.
* The company continues expanding its global project pipeline across renewable energy, water desalination, and green hydrogen.
* Several major projects have already entered commercial operation, while others are expected to contribute gradually over the coming years.
* Although ROE and ROA have softened, this is largely consistent with a capital-intensive growth strategy.
In my opinion, the market is currently pricing near-term earnings more heavily than the long-term cash flow potential of these projects.
My estimated fair value remains around SAR 220–250, assuming project execution continues as planned.
Technical View
Technically, the stock has stabilized after a prolonged decline and is now attempting to establish a higher base.
* Buyers defended the recent lows successfully.
* Trading volume increased during the rebound, suggesting renewed institutional interest.
* Momentum indicators have started to improve, although confirmation is still required.
Important levels:
* Building Zone: SAR 193–180
* Strong Demand Zone: SAR 180–164
* Major Resistance: SAR 212–215
A confirmed breakout above the resistance zone could open the door toward the SAR 220–250 target range.
Conclusion
As long as the company’s fundamentals remain intact and project execution continues, I believe the recent correction has significantly improved the long-term risk/reward profile.  Long
Long
United Wire Factories : Upside Leg after ConsolidationTADAWUL:1301
🚀 Healthy Consolidation After the Bounce — Is the Stock Preparing for Its Next Leg Higher? 🇸🇦
The stock continues to display a constructive bullish setup, with price consolidating inside a defined range following its recent move.
At this stage, consolidation isn't weakness—it could be exactly what the trend needs before attempting another upside expansion.
🔍 Why Consolidation Is Positive
Any healthy sideways consolidation within the current box/range should be viewed constructively.
Instead of immediately retracing the previous move, price holding its ground would suggest:
✅ Buyers are absorbing selling pressure.
✅ Previous gains are being protected.
✅ A potential accumulation base is forming.
✅ The market is preparing for its next directional move.
The longer price successfully holds its key support structure, the stronger the foundation for a potential breakout becomes.
📊 Bullish Divergence Adds Confidence
Another encouraging signal is the positive/bullish divergence visible on the chart.
This suggests that downside momentum has weakened and could indicate an underlying momentum shift in favor of buyers.
However, after the recent move, some indicators are becoming stretched.
⚠️ Momentum Needs to Cool Down
For the next rally to remain sustainable, the technical indicators would ideally reset through either time or price.
This can happen through:
📌 Sideways consolidation
📌 A controlled pullback
📌 Formation of a Higher Low (HL)
A momentum reset without significant price deterioration would be particularly bullish.
🛡️ Key Support Zones
Two important downside levels deserve close attention:
🔹 17.70 – First Support
🔹 16.40 – Major Support
As long as buyers continue defending these areas, the broader bullish thesis remains constructive.
🎯 Upside Targets
If consolidation resolves to the upside and bullish momentum resumes, the next potential profit-taking/resistance zones are:
🎯 20.60 – Immediate upside objective
🎯 25.60 – Secondary target
🎯 29.00 – Major upside target
🔥 Extended Bullish Targets
If price successfully clears these resistance levels and transitions into a stronger trend expansion, the longer-term targets could extend toward:
🚀 36.50
🚀 49.00
These extended targets become increasingly relevant only if the stock continues establishing a healthy HH-HL market structure and confirms breakouts along the way.
📊 My View
The technical picture remains bullish but patience is important here.
17.70–16.40 Support → Consolidation → Momentum Reset → Breakout → 20.60 → 25.60 → 29 → 36.50 → 49
The ideal scenario isn't necessarily an immediate rally.
A period of healthy consolidation, indicator cooldown, and formation of a Higher Low could actually make the next breakout more convincing.
Sometimes the strongest move comes after the market becomes boring. Consolidation today could fuel expansion tomorrow. 🚀
Would you accumulate during consolidation or wait for the breakout confirmation? 👇
⚠️ Financial Disclaimer
Disclaimer: This analysis is provided for educational and informational purposes only and does not constitute financial, investment, or trading advice. Technical setups and price targets are probabilistic, not guaranteed. Always conduct your own research (DYOR) and apply appropriate risk management.
#Tadawul #SaudiStockMarket #SaudiStocks #TASI #SaudiTrading #SaudiInvesting #SaudiInvestors #KSAStocks #SaudiEquities #RiyadhMarket #GCCMarkets #MiddleEastMarkets
#TechnicalAnalysis #TradingView #PriceAction #BullishDivergence #Consolidation #Accumulation #Breakout #HigherLow #HigherHigh #MarketStructure #BullishSetup #SupportAndResistance #MomentumTrading #SwingTrading #TrendFollowing #BreakoutTrading #ChartAnalysis #TradingIdeas #StockAnalysis #RiskManagement #BuyTheDip
#WiSHFundManagement  Long
Long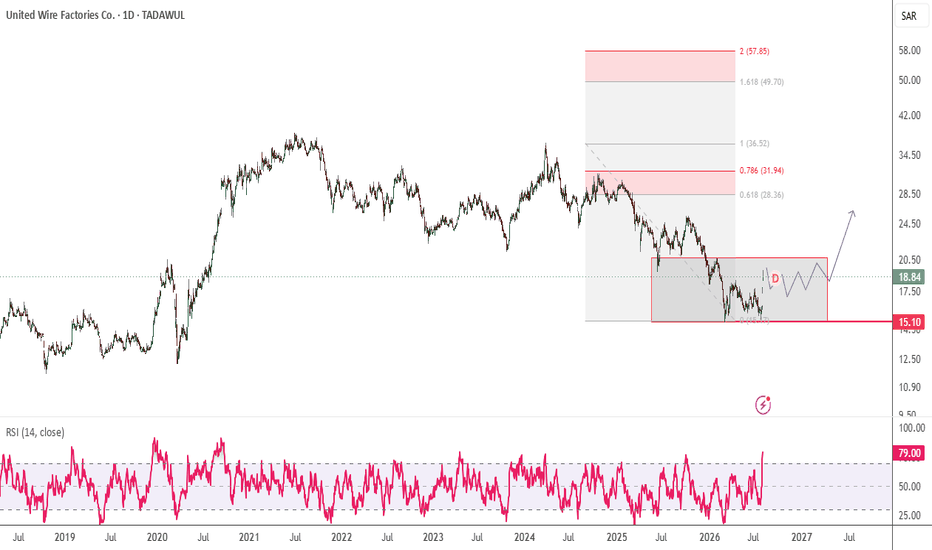
Basic Chemical : Triple Confluence for Upside !TADAWUL:1210
📈 Descending Channel Meets Triple Confluence — Is a Bullish Reversal Brewing? 🇸🇦
The stock continues to trade within a well-defined descending parallel channel, but several technical signals suggest that selling pressure may be fading and a reversal could be taking shape.
With multiple bullish confluences aligning, this is a setup worth keeping on your watchlist.
🔍 Why This Setup Stands Out
📌 1. Descending Parallel Channel
Price remains confined within a descending channel, with the upper boundary acting as the first upside objective if buyers regain control.
A move toward the channel top would offer an attractive swing trading opportunity.
📌 2. Bullish Divergence at 22
The stock has formed a bullish divergence around the 22 level, indicating that bearish momentum is weakening despite price remaining near recent lows.
Historically, this type of divergence often precedes trend reversals when confirmed by price action.
📌 3. Fibonacci Discount Zone
The 22 support area also aligns closely with the 0.786 Fibonacci retracement, creating a high-conviction demand zone where institutional buying interest often emerges.
The combination of bullish divergence + 0.786 Fibonacci + channel support strengthens the technical significance of this area.
👀 One Missing Piece: A Higher Low (HL)
Despite the improving setup, one important confirmation is still missing—the formation of a Higher Low (HL).
A healthy pullback that establishes an HL would:
✅ Confirm the shift in market structure.
✅ Allow momentum indicators (such as RSI) to cool off naturally.
✅ Increase the probability of a sustainable rally instead of a short-lived bounce.
This would provide a much stronger entry than chasing the initial rebound.
🎯 Buy-the-Dip Strategy
If the stock forms a Higher Low, any controlled pullback could present a buy-on-dip opportunity with an initial target at the upper boundary of the descending channel.
Short-Term Targets:
🎯 26.80
🎯 27.62
🚀 Medium-to-Long-Term Outlook
A confirmed breakout above the channel would shift the focus toward larger Fibonacci retracement targets:
📈 Target 1: 38
📈 Target 2: 48
🚀 Extended Target: 63
These levels represent the next major resistance zones and would only become relevant if the stock confirms a complete trend reversal.
📊 My View
The chart is approaching a high-probability reversal setup, but patience remains essential.
✅ Bullish divergence around 22.
✅ 0.786 Fibonacci demand zone providing support.
✅ Descending channel nearing a potential breakout.
⏳ Still waiting for a Higher Low (HL) to confirm the trend reversal.
The best opportunities often come after confirmation—not anticipation. A Higher Low could be the final piece that turns this into a high-conviction bullish setup.
Do you think the bulls will defend the 22 demand zone and break out of the channel, or will the downtrend continue? Share your technical view below! 👇
#Tadawul #SaudiStockMarket #SaudiStocks #TASI #SaudiInvesting #SaudiTrading #SaudiInvestors #KSAStocks #SaudiEquities #MiddleEastMarkets #GCCMarkets
#TechnicalAnalysis #TradingView #PriceAction #DescendingChannel #BullishDivergence #Fibonacci #FibonacciRetracement #HigherLow #MarketStructure #SupportAndResistance #SwingTrading #TrendFollowing #BreakoutTrading #MomentumTrading #ChartAnalysis #TradingIdeas #StockAnalysis #BullishSetup #RiskManagement #Investing
#WiSHFundManagement  Long
Long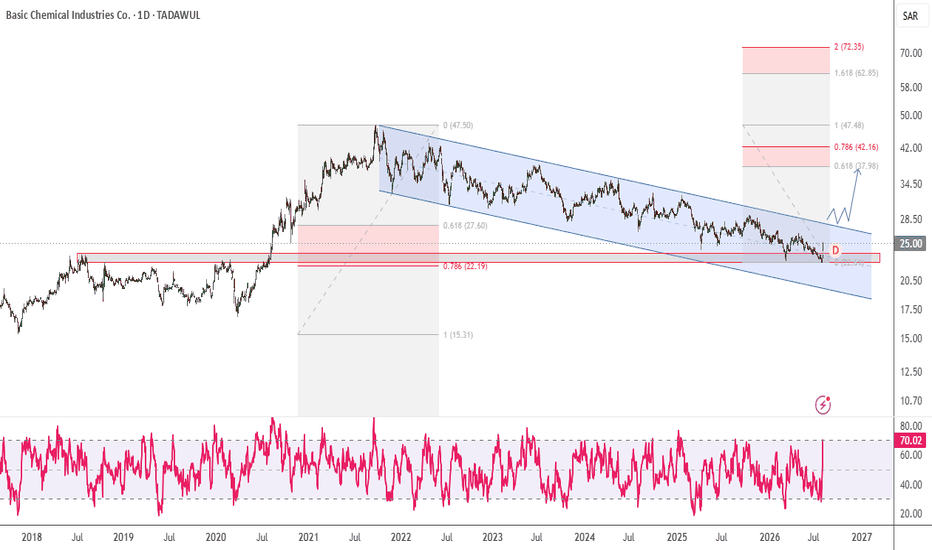
Mouwasat Medical Services – Is a Reversal Finally Taking Shape?After a prolonged correction from its all time high near 145 SAR, Stock has since been in downtrend, bringing price back into a major historical support zone around 60–65 SAR with a double bottom. This area has previously acted as an important demand zone and is now attracting attention again.
The long term trend remains bearish, with a clear sequence of Lower Highs (LH) and Lower Lows (LL) since the 2024 peak. However, markdown volumes has started to slow, suggesting sellers may be losing control.
Price is still trading below the major moving averages (20, 50, 100, and 200 MA), confirming that the primary trend remains negative.
gradual reduction in selling volume during the latest leg lower. This often indicates that aggressive selling pressure is fading.
Major Support
60–65 SAR
50 SAR
Resistance
75 SAR
90 SAR
100 SAR
120 SAR
Failure to hold the current support could expose the stock to another leg lower toward the 50s. A weekly close below this area would invalidate the developing base and keep the long-term bearish trend intact.
Disclaimer:
The information provided is for educational and informational purposes only. It does not constitute financial or investment advice. Trading and investing in stocks involves risk, including the possible loss of capital. Any decisions to buy, sell, or hold securities are the sole responsibility of the reader. Past performance is not indicative of future results. Always do your own research and, if necessary, consult with a licensed financial advisor before making investment decisions. From Accumulation to Markup - A Trend Reversal in ProgressAfter a long markdown phase, where the price kept making lower highs and lower lows, it started moving sideways around the 12–13 SAR area. That sideways movement looks like an accumulation phase, where buyers were quietly building positions while volatility stayed low. The recent breakout from this range, backed by a noticeable increase in volume, suggests the stock has now entered the markup phase.
The 20, 50, 100, and 200 moving averages are all turning bullish, with the price trading above them, which is a good sign that the trend has shifted in favor of the buyers. The strong volume during the breakout adds confidence that this move has real buying interest behind it. A small pullback or consolidation after such a strong rally would be completely normal, but as long as the price stays above the key moving averages, the overall outlook remains positive.
Disclaimer:
The information provided is for educational and informational purposes only. It does not constitute financial or investment advice. Trading and investing in stocks involves risk, including the possible loss of capital. Any decisions to buy, sell, or hold securities are the sole responsibility of the reader. Past performance is not indicative of future results. Always do your own research and, if necessary, consult with a licensed financial advisor before making investment decisions. Thob Al-Aseel : Breakout for Upside RallyTADAWUL:4012
🚀 Trendline Breakout Loading? A Sustained Move Above 4 SAR Could Trigger Strong Upside 🇸🇦
The stock is showing encouraging signs of recovery after bouncing from a high-probability Fibonacci demand zone, and it's now approaching a critical trendline resistance that could define the next major move.
This is a setup where confirmation—not anticipation—can offer the best risk-to-reward opportunity.
🔍 Technical Outlook
The recent rebound originated from 3.11 SAR, which coincides with the 0.786 Fibonacci retracement of the 2.58 → 5.20 bullish swing.
This deep retracement level is widely regarded as an institutional accumulation zone, and the strong reaction suggests buyers are beginning to regain control.
📈 Breakout Level to Watch
The key trigger remains the descending trendline resistance.
A confirmed breakout, followed by a successful breakout–retest above 4.00 SAR, would provide strong technical confirmation that the downtrend has ended and a new bullish phase is underway.
✅ Bullish Confirmation Checklist
Trendline breakout
Sustained price above 4.00 SAR
Breakout–retest confirmation
Rising volume and bullish momentum
When these conditions align, the probability of a rapid upside expansion increases significantly.
🎯 My View
The rebound from 3.11 (0.786 Fibonacci retracement) has kept the bullish structure alive, but the market still needs to prove itself.
👀 Key Support: 3.11 SAR (0.786 Fibonacci demand zone)
🚀 Key Confirmation: Break and hold above 4.00 SAR
Rather than chasing price before confirmation, I'd prefer to wait for the breakout–retest to validate the trend reversal. Once confirmed, the stock could become an attractive momentum candidate for swing traders.
Will the bulls reclaim 4 SAR and trigger the next breakout, or will the trendline reject price once again? Share your technical view below! 👇
⚠️ Financial Disclaimer
Disclaimer: This analysis is shared for educational and informational purposes only and should not be considered financial, investment, or trading advice. Always conduct your own research (DYOR) and apply disciplined risk management before making investment decisions.
#Tadawul #SaudiStockMarket #SaudiStocks #TASI #SaudiInvesting #SaudiTrading #SaudiInvestors #KSAStocks #SaudiEquities #RiyadhMarket #GCCMarkets #MiddleEastMarkets
#TechnicalAnalysis #TradingView #PriceAction #TrendlineBreakout #BreakoutRetest #Fibonacci #FibonacciRetracement #BullishSetup #MarketStructure #SupportAndResistance #SwingTrading #MomentumTrading #TrendFollowing #ChartAnalysis #TradingIdeas #StockAnalysis #RiskManagement #Investing #BreakoutTrading #TechnicalTrader
#WiSHFundManagement  Long
Long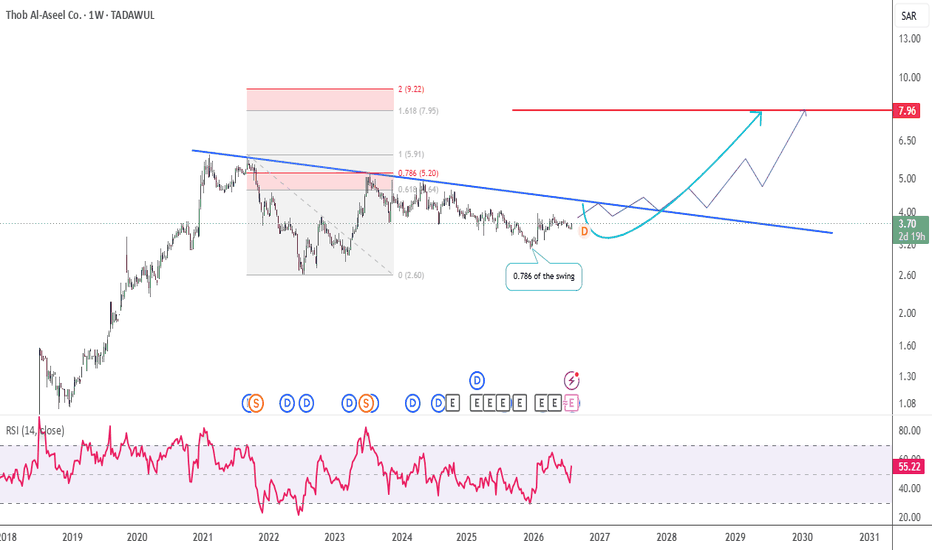
Saudi Arabian Oil : Bullish Wedge for Upside RallyTADAWUL:2222
🚀 Bullish Wedge in Play — Can the Stock Trigger Its Next Breakout? 🇸🇦
The stock is developing a Bullish Wedge pattern, a technical setup that often precedes a strong upside breakout when supported by volume and momentum.
Price is now approaching a critical confirmation level, making the coming sessions particularly important for trend followers.
🔍 Technical Outlook
The current structure remains constructive, with buyers gradually absorbing supply within the wedge formation.
However, the 28 level is the key breakout trigger.
A sustained move above this level would confirm bullish strength and increase the probability of a continuation rally.
📈 Bullish Scenario
If price successfully breaks and holds above 28, the wedge breakout could unlock the following upside targets:
🎯 Target 1: 30
🎯 Target 2: 35
🎯 Target 3: 37
These levels represent the next major resistance zones where traders should monitor price action for momentum continuation or profit-taking.
⚠️ Bearish Scenario
Failure to sustain above 28 would invalidate the immediate bullish breakout thesis.
In that case, the stock could revisit the 22 support zone, where buyers may attempt to rebuild the trend.
A healthy correction toward this level would not necessarily change the long-term outlook but would delay the anticipated breakout.
📊 My View
This is a high-risk, high-reward technical setup approaching its decision point.
✅ Above 28: Confirms the bullish wedge breakout and opens the path toward 30 → 35 → 37.
⚠️ Below 28: Increases the probability of a pullback toward 22, where the next accumulation opportunity may emerge.
As always, confirmation beats prediction. Let the breakout prove itself before committing capital.
Do you expect the bulls to reclaim 28 and ignite the next rally, or will the stock revisit 22 before making its move? Share your analysis below! 👇
⚠️ Financial Disclaimer
Disclaimer: This analysis is provided for educational and informational purposes only and should not be considered financial, investment, or trading advice. Always conduct your own research (DYOR) and practice disciplined risk management before making any investment decisions.
#Tadawul #SaudiStockMarket #SaudiStocks #TASI #SaudiInvesting #SaudiTrading #SaudiInvestors #KSAStocks #SaudiEquities #RiyadhMarket #GCCMarkets #MiddleEastMarkets
#TechnicalAnalysis #TradingView #PriceAction #BullishWedge #ChartPattern #Breakout #BreakoutTrading #MarketStructure #SupportAndResistance #SwingTrading #TrendFollowing #MomentumTrading #ChartAnalysis #TradingIdeas #StockAnalysis #BullishSetup #RiskManagement #Investing #StockMarket #PriceActionTrading
#WiSHFundManagement  Long
Long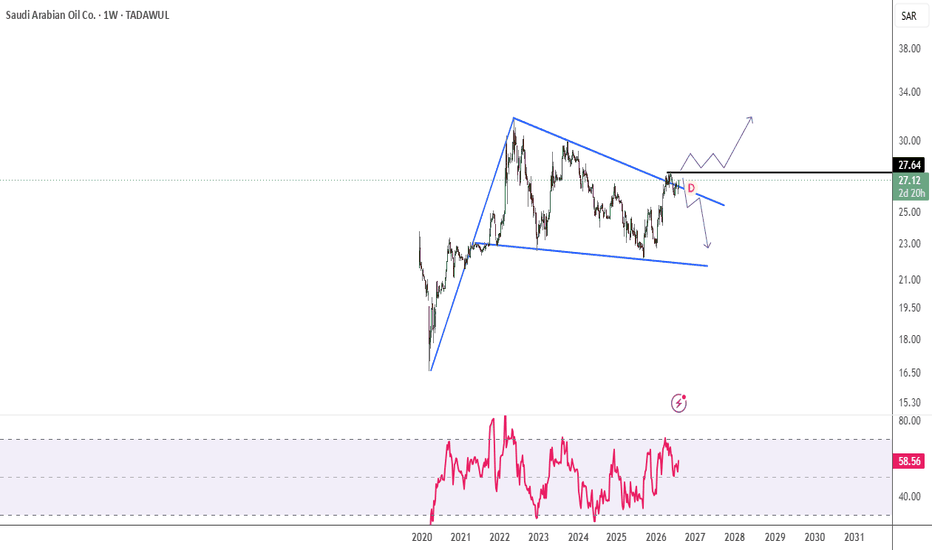
Alanalus Property : A Buy-the-Dip Opportunity? TADAWUL:4320
📈 Strong Historical Support at 13.40: A Buy-the-Dip Opportunity?
The stock has delivered a healthy rebound after finding support around the 13.40 level—a price zone that has repeatedly acted as a major weekly reversal area in the past.
Historical support zones often attract institutional buying, making this level one to watch closely for the next swing opportunity.
🔍 Technical Outlook
The recent bounce confirms that 13.40 remains a significant demand zone, where buyers have previously stepped in to defend the trend.
While the short-term momentum has improved, disciplined traders should avoid chasing the rally and instead focus on high-probability entry zones.
🎯 Buy-the-Dip Strategy
If the stock undergoes a healthy correction, the 13.40 support zone will be the key level to monitor.
📍 Key Support: 13.40
A successful retest of this level, accompanied by bullish price action and increasing volume, could provide an attractive risk-to-reward buying opportunity.
As long as this support remains intact, the broader recovery structure stays constructive.
📊 My View
The stock has already demonstrated that 13.40 is a proven reversal zone.
Rather than chasing higher prices, I would prefer to wait for a controlled pullback into this demand area and look for confirmation before building new positions.
Strong support levels often provide the best opportunities—not when they're first touched, but when they successfully hold after a retest.
Will buyers defend 13.40 once again, or will sellers force a deeper correction? Share your technical view below! 👇
⚠️ Financial Disclaimer
Disclaimer: This analysis is shared for educational and informational purposes only and should not be considered financial, investment, or trading advice. Always conduct your own research (DYOR) and apply proper risk management before making investment decisions.
#Tadawul #SaudiStockMarket #SaudiStocks #TASI #SaudiInvesting #SaudiTrading #SaudiInvestors #KSAStocks #SaudiEquities #MiddleEastMarkets #GCCMarkets
#TechnicalAnalysis #TradingView #PriceAction #MarketStructure #SupportAndResistance #DemandZone #BuyTheDip #SwingTrading #TrendFollowing #ChartAnalysis #TradingIdeas #StockAnalysis #BullishSetup #MomentumTrading #RiskManagement #Breakout #Investing #StockMarket #PriceActionTrading #TechnicalTrader
#WiSHFundManagement  Long
Long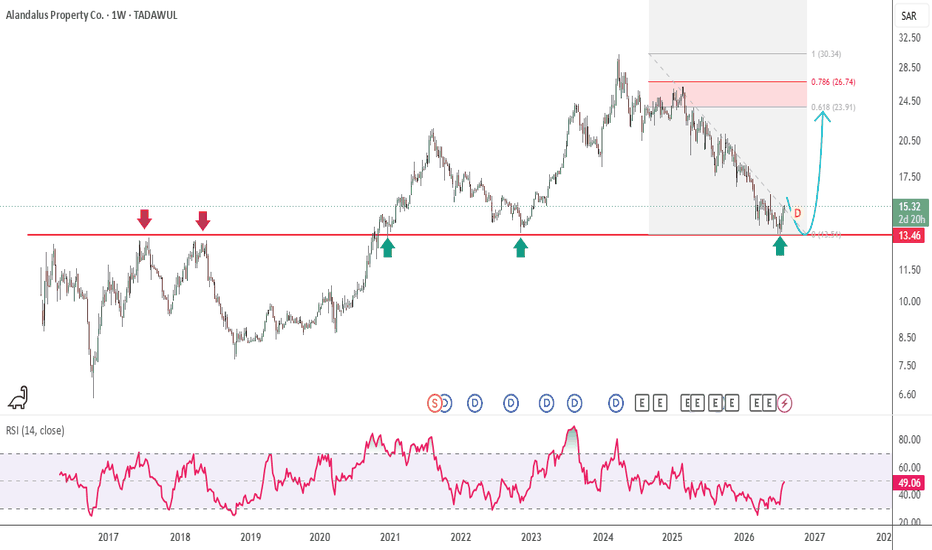
Saudi Darb Investment : the Start of a Multi-Bagger Move? 🇸🇦TADAWUL:4130
🚀 Weekly Reversal at 2.50: Is This the Start of a Multi-Bagger Move? 🇸🇦
The stock is approaching a major weekly reversal zone around 2.50, a level that could determine the beginning of its next long-term trend.
After spending a prolonged period in accumulation, price is now testing a critical resistance where confirmation—not anticipation—should guide trading decisions.
🔍 Technical Outlook
The 2.50 level is the first major hurdle for the bulls.
A decisive breakout, followed by sustained trading above this zone, would confirm improving market structure and significantly increase the probability of a medium-to-long-term rally.
This is the level where market sentiment could shift from accumulation to expansion.
📈 AB=CD Harmonic Pattern in Progress
Adding further conviction to the bullish outlook, the weekly chart is developing a potential AB=CD harmonic pattern.
If the current structure continues to unfold as expected, the pattern projects completion around:
🎯 8.00–10.00, aligning with the 1.618 Fibonacci Extension.
This confluence of harmonic analysis and Fibonacci projections strengthens the long-term upside potential.
🎯 Profit-Taking Zones
Following a confirmed breakout above 2.50, the next technical objectives are:
📍 Target 1: 3.00
📍 Target 2: 4.83
📍 Target 3: 6.64
Each of these levels represents a potential profit-taking and resistance zone, where traders should monitor momentum and price action before expecting further continuation.
📊 My View
The stock is approaching a make-or-break technical level.
✅ Weekly resistance at 2.50 is the trigger that deserves close attention.
✅ A successful breakout could confirm the next bullish phase.
✅ The AB=CD harmonic pattern projects a medium-to-long-term target in the 8.00–10.00 region.
✅ 3.00 → 4.83 → 6.64 are key milestones where traders may consider partial profit-taking or reassessing momentum.
This is not a stock to chase before confirmation. The higher-probability strategy is to wait for a clean breakout above 2.50 with strong weekly closes and increasing volume.
Will the 2.50 resistance finally give way and ignite a new long-term rally, or will buyers need more time before the next breakout? Share your technical outlook below! 👇
#Tadawul #SaudiStockMarket #SaudiStocks #TASI #SaudiInvesting #SaudiTrading #SaudiInvestors #KSAStocks #SaudiEquities #RiyadhMarket #MiddleEastMarkets #GCCMarkets
#TechnicalAnalysis #TradingView #PriceAction #ABCDPattern #HarmonicPattern #Fibonacci #FibonacciExtension #WeeklyChart #Breakout #TrendReversal #MarketStructure #SupportAndResistance #SwingTrading #MomentumTrading #ChartAnalysis #TradingIdeas #StockAnalysis #BullishSetup #TrendFollowing #LongTermInvesting
#WiSHFundManagement
 Long
Long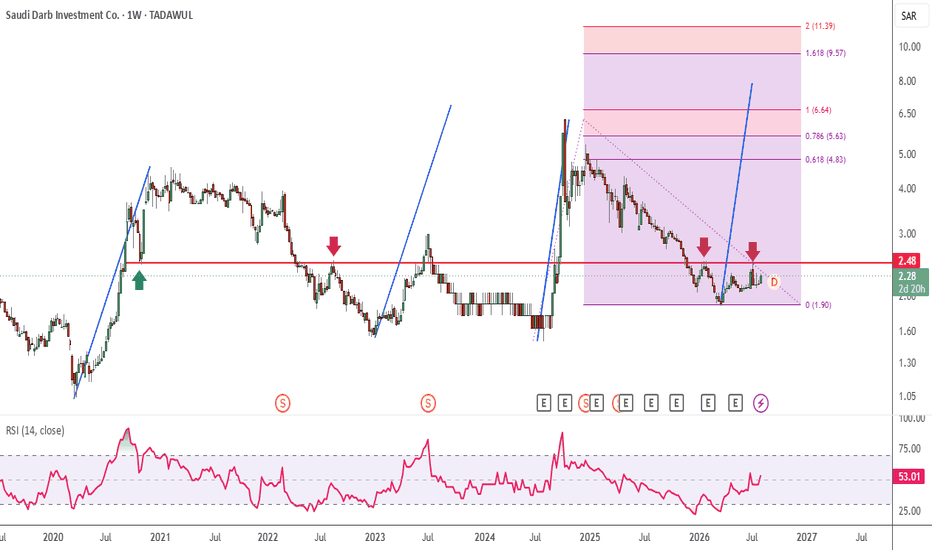
Fitaihi Holding Group : Triple Confluence in Play 🇸🇦TADAWUL:4180
🚀 Triple Confluence in Play: Is This the Next High-Probability Reversal Zone? 🇸🇦
The stock is approaching a high-confluence technical area, where multiple bullish signals are beginning to align.
While the broader trend still requires confirmation, the current setup deserves a place on every swing trader's watchlist.
🔍 Three Technical Confluences Supporting the Bullish Case
📌 1. Bull Flag Formation
Price continues to develop a Bull Flag, a classic continuation pattern that often appears before the next impulsive move.
A confirmed breakout from this structure could attract fresh buying momentum.
📌 2. Deep Fibonacci Discount Zone
The stock is trading within the 0.618–0.786 Fibonacci retracement zone—an area widely regarded as a high-probability institutional accumulation zone.
Historically, this range has often produced strong rebounds when supported by bullish price action.
📌 3. Weekly Reversal Zone at 2.60
The 2.60 price level has repeatedly acted as a major weekly reversal point, making it one of the most significant support zones on the chart.
The convergence of historical support, Fibonacci retracement, and the flag pattern strengthens the technical importance of this area.
📊 RSI: Momentum Confirmation Still Needed
Momentum is also beginning to improve.
The Relative Strength Index (RSI) is approaching the 50 level, which often marks the transition from bearish to bullish momentum.
👀 Key RSI Trigger:
✅ A sustained move above 50 would indicate improving buying strength.
🚀 A breakout into the 50–60 RSI zone would provide stronger confirmation that bulls are regaining control and that momentum is shifting in favor of an upside continuation.
📈 My View
This is one of those setups where confluence matters more than any single indicator.
✅ Bull Flag pattern developing.
✅ Trading inside the 0.618–0.786 Fibonacci discount zone.
✅ Strong weekly support at 2.60.
✅ RSI approaching a bullish momentum shift.
Rather than predicting the breakout, I'd prefer to wait for price confirmation and RSI strength before increasing exposure.
If buyers successfully defend this zone and momentum confirms, this setup could evolve into a high-probability swing trading opportunity.
Will this triple-confluence zone trigger the next bullish breakout, or will sellers defend the range once again? Share your technical outlook below! 👇
#Tadawul #SaudiStockMarket #SaudiStocks #TASI #SaudiInvesting #SaudiTrading #SaudiInvestors #KSAStocks #SaudiEquities #MiddleEastMarkets #GCCMarkets
#TechnicalAnalysis #TradingView #PriceAction #BullFlag #ChartPattern #Fibonacci #FibonacciRetracement #DemandZone #RSI #MarketStructure #SupportAndResistance #SwingTrading #BreakoutTrading #TrendFollowing #MomentumTrading #ChartAnalysis #TradingIdeas #StockAnalysis #BullishSetup #RiskManagement
#WiSHFundManagement  Long
Long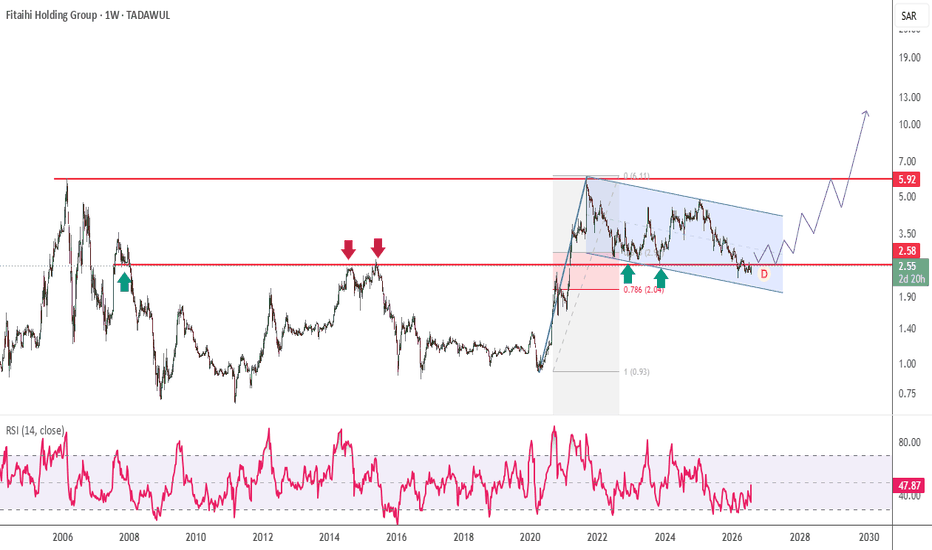
Rabigh Refining & Petrochemical : Parallel Channels 🇸🇦TADAWUL:2380
📈 Weekly Parallel Channel Nearing Resolution — Is a Multi-Year Breakout Around the Corner? 🇸🇦
The stock continues to trade within a well-defined weekly parallel channel, keeping the long-term trend at a decisive technical juncture.
After months of consolidation, price is now approaching the upper boundary of the channel, where the next major trend is likely to emerge.
🔍 Technical Outlook
The broader structure remains constructive, but buyers still need to clear two key resistance levels before a confirmed breakout can be declared.
📌 First Resistance: 20
📌 Major Breakout Level: 25
These levels represent the upper boundary of the weekly channel and are likely to determine whether the stock enters a new bullish phase.
🚀 Bullish Scenario
A sustained breakout above 20, followed by a decisive move through 25 with strong volume and bullish weekly closes, would confirm a channel breakout.
Once this resistance zone is reclaimed, the technical picture improves significantly, opening the door for a potential rally toward the stock's:
🎯 All-Time High: 45
Breaking out of a long-term consolidation pattern often attracts fresh momentum traders and long-term investors, making this one of the most important setups to monitor.
⚠️ Why Patience Matters
Until the breakout is confirmed, the stock remains range-bound inside the weekly channel.
Rather than anticipating the move, it's prudent to wait for:
✅ Weekly close above 20
✅ Strong breakout above 25
✅ Rising volume confirming buying interest
✅ Successful retest of the breakout zone
Confirmation helps reduce false breakouts and improves the overall risk-to-reward profile.
📊 My View
This is a classic "watchlist before breakout" setup.
👀 Key Levels: 20 → 25
🚀 Breakout Confirmation: Weekly close above the channel resistance.
🎯 Long-Term Target: 45 (All-Time High)
The stock is approaching a make-or-break technical zone. If bulls successfully reclaim 25, the next major trend could already be underway.
Do you think this weekly channel is preparing for a breakout, or will sellers defend resistance once again? Share your technical view below! 👇
#Tadawul #SaudiStockMarket #SaudiStocks #TASI #SaudiInvesting #SaudiTrading #SaudiInvestors #KSAStocks #SaudiEquities #MiddleEastMarkets #GCCMarkets
#TechnicalAnalysis #TradingView #PriceAction #WeeklyChart #MarketStructure #TrendReversal #BullishDivergence #HigherLow #EMA200 #Fibonacci #Breakout #SupportAndResistance #SwingTrading #TrendFollowing #MomentumTrading #ChartAnalysis #TradingIdeas #StockAnalysis #BullishSetup #RiskManagement
#WiSHFundManagement  Long
Long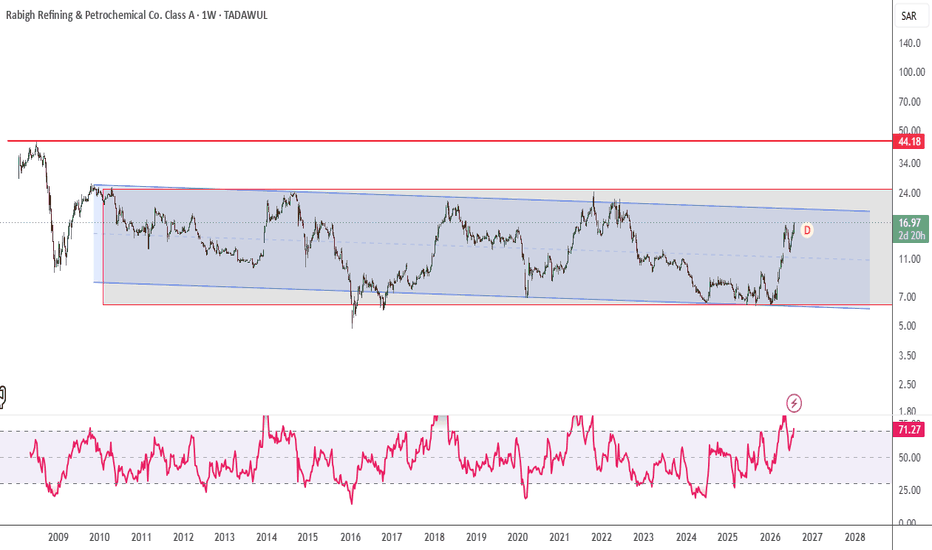
Saudi Kayan : Reclaim the Long-Term Trend? 🇸🇦TADAWUL:2350
📈 Weekly Reversal Taking Shape — Can Buyers Reclaim the Long-Term Trend? 🇸🇦
After a prolonged decline, the stock is beginning to show early signs of a weekly trend reversal, rebounding strongly from the 4.40 support zone.
While the recovery is still in its early stages, the technical picture is becoming increasingly constructive as buyers gradually regain control.
🔍 Technical Outlook
The bullish case is supported by multiple technical signals:
✅ Bullish divergence suggests downside momentum is fading.
✅ Price has formed a Higher Low (HL) around 4.90, indicating the first signs of a bullish market structure.
✅ Weekly price action continues to improve, keeping the reversal thesis intact.
Although these are encouraging developments, confirmation remains the key.
🚀 Breakout Level to Watch
The 6.30–6.40 resistance zone is the first major hurdle.
A sustained breakout and close above this range would signal growing buyer confidence and strengthen the probability of a continued rally.
If bulls successfully reclaim this level, the next upside targets are:
🎯 Target 1: 8.00
🎯 Target 2: 11.00
🎯 Target 3: 13.00
🎯 Extended Target: 16.60, aligning with the 0.618 Fibonacci retracement level.
⚠️ Weekly 200 EMA: The Make-or-Break Zone
One of the most important technical levels on the chart is the Weekly 200 EMA, currently positioned around 8.00.
This dynamic resistance is likely to determine whether the current recovery evolves into a sustained long-term uptrend or faces temporary selling pressure.
A decisive breakout above the Weekly 200 EMA, supported by strong volume and bullish weekly candles, would significantly strengthen the long-term outlook.
📊 My View
The chart is beginning to transition from accumulation to recovery, but the market still needs confirmation before a high-conviction entry.
📈 Bullish Signals:
Rebound from 4.40 support.
Bullish divergence on the weekly chart.
Formation of a Higher Low at 4.90.
👀 Key Confirmation Levels:
6.30–6.40: Initial breakout trigger.
8.00 (Weekly EMA200): Major trend confirmation.
🚀 Bullish Targets: 8.00 → 11.00 → 13.00 → 16.60
Rather than trying to predict the move, let the market confirm the breakout. Strong trends are built on confirmation—not anticipation.
Do you think this is the beginning of a long-term reversal, or will the Weekly 200 EMA prove to be a tough barrier? Share your technical view below! 👇
⚠️ Financial Disclaimer
Disclaimer: This analysis is shared for educational and informational purposes only and should not be considered financial, investment, or trading advice. Always conduct your own research (DYOR) and apply appropriate risk management before making investment decisions.
#Tadawul #SaudiStockMarket #SaudiStocks #TASI #SaudiInvesting #SaudiTrading #SaudiInvestors #KSAStocks #SaudiEquities #MiddleEastMarkets #GCCMarkets
#TechnicalAnalysis #TradingView #PriceAction #WeeklyChart #MarketStructure #TrendReversal #BullishDivergence #HigherLow #EMA200 #Fibonacci #Breakout #SupportAndResistance #SwingTrading #TrendFollowing #MomentumTrading #ChartAnalysis #TradingIdeas #StockAnalysis #BullishSetup #RiskManagement #WiSHFundManagement
 Long
Long
Herfy Food : Reversal Finally Taking Shape? 🇸🇦TADAWUL:6002
Is a Long-Term Reversal Finally Taking Shape? 🇸🇦
The stock is currently trading below its IPO (inception) price, reflecting the prolonged bearish sentiment that has dominated its price action. However, beneath the surface, the weekly chart is beginning to show early signs of accumulation and a potential structural reversal.
For long-term investors, this is a stock worth monitoring—not rushing into.
🔍 Technical Outlook
Although the broader trend has yet to confirm a breakout, several technical developments suggest that sellers may be losing control.
✅ Lower Low Bullish Divergence indicates weakening downside momentum.
✅ Price has rebounded from an area resembling a double bottom, a pattern often associated with medium-to-long-term trend reversals.
✅ The weekly structure is gradually improving, keeping the bullish scenario intact.
These signals are encouraging—but confirmation remains essential.
🎯 The Ideal Entry Strategy
As technical analysts, our objective is not to catch the exact bottom—it's to maximize probability while minimizing risk.
Rather than buying purely because the stock looks "cheap," I'd prefer to wait for:
📌 A confirmed breakout above the long-term descending trendline.
📌 Strong bullish weekly candles closing above the breakout level.
📌 Weekly RSI moving above the 60 level, signaling improving momentum and institutional buying strength.
When these conditions align, the probability of a sustained trend reversal increases significantly.
📊 Why Patience Matters
Many stocks appear attractive near multi-year lows, but not all of them reverse.
Waiting for price confirmation, momentum confirmation, and trend confirmation helps reduce downside risk and improves the quality of every trade.
Sometimes the first 10–15% of a move is worth sacrificing if it means entering a higher-probability trend with a healthier risk-to-reward profile.
📈 My View
The weekly chart is becoming increasingly interesting, but the trend has not fully confirmed yet.
👀 Watchlist Candidate: Yes.
🚀 Aggressive Entry: Only after a confirmed trendline breakout.
📊 Momentum Confirmation: Weekly RSI above 60 with strong bullish candles.
🛡️ Priority: Preserve capital first—profits follow disciplined execution.
Remember: The best trades aren't the ones bought at the absolute bottom—they're the ones confirmed by the market.
Do you prefer anticipating reversals, or do you wait for confirmation before committing capital? Share your strategy below! 👇
#Tadawul #SaudiStockMarket #SaudiStocks #TASI #SaudiInvesting #SaudiTrading #SaudiInvestors #KSAStocks #SaudiEquities #MiddleEastMarkets #GCCMarkets
#TechnicalAnalysis #TradingView #PriceAction #MarketStructure #TrendlineBreakout #BullishDivergence #DoubleBottom #RSI #WeeklyChart #TrendReversal #SwingTrading #SupportAndResistance #BreakoutTrading #MomentumTrading #ChartAnalysis #TradingIdeas #StockAnalysis #RiskManagement #LongTermInvesting #BullishSetup #WiSHFundManagement  Long
Long
Saudi Tadawul Group 1111Saudi Tadawul Group reported decent Q2 results, but I believe the market focused too much on lower earnings and ignored the bigger picture.
The decline in profit was mainly driven by lower trading activity across the Saudi market, not by a deterioration in the company’s business.
What caught my attention is that management continues to execute its long-term strategy.
The company is becoming much more than just a stock exchange.
Technology, data services, post-trade services, and derivatives continue to grow and gradually reduce the company’s dependence on trading commissions.
This is exactly what I want to see from a business like Tadawul.
The balance sheet remains strong, cash generation is healthy, and the company continues investing in future growth instead of relying only on today’s trading volumes.
In my opinion, the market is valuing the company based on current market activity rather than its long-term earnings potential.
My Fair Value
* Conservative: SAR 120
* Base Case: SAR 132
* Bull Case: SAR 145
If trading activity recovers and IPO momentum continues over the coming quarters, I believe earnings can improve faster than many investors currently expect.
For me, Tadawul remains one of the highest-quality businesses in the Saudi market.  Long
Long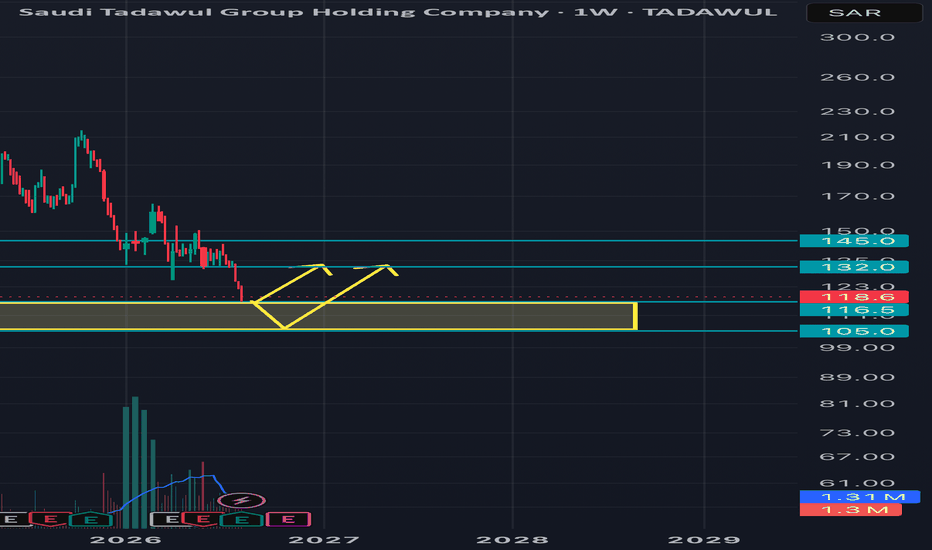
Watani Iron Steel (9513) : Confirmation Before the Next Move !!TADAWUL:9513
📈 Weekly Trendline Retest: Waiting for Confirmation Before the Next Move 🇸🇦
The stock has successfully retested its long-term weekly trendline, placing it at a critical technical decision point.
While the setup is becoming increasingly constructive, confirmation is still required before considering a high-conviction entry.
🔍 Technical Outlook
The current price action suggests that the market is attempting to convert the previous resistance into support.
However, rather than anticipating the move, I prefer to wait for a confirmed breakout–retest before building a position.
A successful confirmation would significantly strengthen the bullish case and improve the overall risk-to-reward profile.
📌 Daily 200 EMA: Key Dynamic Support
Another important technical level to monitor is the Daily 200 EMA, currently positioned around 1.97.
This area represents a strong confluence support zone and could become the foundation for the next bullish leg if buyers continue defending it.
👀 Medium-Term Watchlist Candidate
From a medium-term investment perspective, this stock deserves a place on the watchlist.
Rather than chasing price, I'd prefer to wait for:
✅ Confirmed breakout above resistance
✅ Successful retest of the breakout zone
✅ Price holding above the Daily 200 EMA
✅ Strong volume confirming institutional participation
These factors would provide greater confidence that the trend reversal is sustainable.
🎯 Fibonacci Profit-Taking Zones
If the breakout is confirmed and bullish momentum continues, the next technical objectives based on Fibonacci retracement/extension levels are:
🎯 Target 1: 2.80
🎯 Target 2: 3.20
🎯 Target 3: 3.96
These levels are likely to act as profit-taking and resistance zones, where traders should closely monitor price action.
📊 My View
The chart is approaching a high-probability technical setup, but patience remains the edge.
📈 Bullish Confirmation: Breakout followed by a successful retest above the weekly trendline.
🛡️ Key Support: Daily 200 EMA around 1.97.
🚀 Upside Potential: 2.80 → 3.20 → 3.96, provided the bullish market structure remains intact.
This is a stock worth watching—not chasing. Let the market confirm the breakout, then let the trend do the heavy lifting.
Do you think the weekly trendline retest will ignite the next rally, or is one more shakeout needed before the breakout? Share your analysis below! 👇
⚠️ Financial Disclaimer
Disclaimer: This analysis is shared for educational and informational purposes only and should not be considered financial, investment, or trading advice. Always conduct your own research (DYOR) and apply proper risk management before making any investment decisions.
#Tadawul #SaudiStockMarket #SaudiStocks #TASI #SaudiInvesting #SaudiTrading #SaudiInvestors #KSAStocks #SaudiEquities #RiyadhMarket #MiddleEastMarkets #GCCMarkets
#TechnicalAnalysis #TradingView #PriceAction #MarketStructure #WeeklyTrendline #BreakoutRetest #EMA200 #SupportAndResistance #Fibonacci #TrendFollowing #SwingTrading #BreakoutTrading #MomentumTrading #ChartAnalysis #TradingIdeas #StockAnalysis #RiskManagement #BullishSetup #Investing #StockMarket #WiSHFundManagement  Long
Long
Filing & Packing Material (2180) : Bull Run or Cool Off for now?TADAWUL:2180
📈 Weekly Trend Reversal Confirmed — Is This the Beginning of a Bigger Bull Run? 🇸🇦
After an extended period of consolidation, the weekly chart has officially shifted into a bullish market structure, with price now printing a series of Higher Highs (HHs) and Higher Lows (HLs)—one of the strongest technical signals that a trend reversal may already be underway.
The focus now shifts from identifying the bottom to managing the next phase of the uptrend.
🔍 Technical Outlook
The recent HH-HL formation confirms that buyers have regained control, increasing the probability of sustained upside momentum.
Adding further confidence to the bullish case, the Relative Strength Index (RSI) remains in bullish territory, indicating healthy buying pressure and positive momentum.
📌 Daily 200 EMA: The Trend Defender
One of the most important technical levels to monitor is the Daily 200 EMA, currently positioned around 31.
A successful retest and sustained trading above this level would reinforce the long-term bullish structure, turning it into a key dynamic support for future pullbacks.
🎯 Short-Term & Long-Term Targets
🚀 Short-Term Resistance
📍 36.50 remains the immediate resistance zone.
A decisive breakout above this level could trigger fresh momentum and attract additional buyers.
📈 Medium-to-Long-Term Target
If the current HH-HL structure remains intact and the trend continues to strengthen, the next major technical objective is:
🎯 46.00
This remains the preferred upside target as long as the market structure is not invalidated by lower highs or lower lows.
📊 My View
The chart is becoming increasingly constructive.
✅ Weekly Higher High–Higher Low structure confirms the reversal.
✅ RSI remains in bullish territory, supporting continued momentum.
✅ Daily 200 EMA (31) is expected to act as a key support zone on future pullbacks.
✅ A breakout above 36.50 could accelerate the rally toward the 46 medium-term target.
Rather than chasing every green candle, I'd prefer to use healthy pullbacks into support as potential opportunities, while respecting the bullish market structure.
Do you think this trend reversal has enough momentum to reach 46, or will 36.5 prove to be a major hurdle? Share your technical view below! 👇
⚠️ Financial Disclaimer
Disclaimer: This analysis is shared for educational and informational purposes only and should not be considered financial, investment, or trading advice. Always conduct your own research (DYOR) and apply proper risk management before making any investment decisions.
#Tadawul #SaudiStockMarket #SaudiStocks #TASI #SaudiInvesting #SaudiTrading #SaudiInvestors #KSAStocks #SaudiEquities #MiddleEastMarkets #GCCMarkets
#TechnicalAnalysis #TradingView #PriceAction #MarketStructure #HigherHigh #HigherLow #TrendReversal #BullishTrend #EMA200 #RSI #SwingTrading #TrendFollowing #Breakout #MomentumTrading #SupportAndResistance #ChartAnalysis #TradingIdeas #StockAnalysis #Investing #RiskManagement #WiSHFundManagement
 Long
Long


