8300an upward trend in the prices of an industry's stocks or the overall rise in broad market indices, characterized by high investor confidenceLongby Humble_HunterUpdated 0
8190an upward trend in the prices of an industry's stocks or the overall rise in broad market indices, characterized by high investor confidenceLongby Humble_HunterUpdated 0
8100hopeful or confident that something or someone will be successful : optimistic about the future of something or someone. Members of her party are bullish about her reelection. They are bullish about the future of the productLongby Humble_HunterUpdated 0
2130an upward trend in the prices of an industry's stocks or the overall rise in broad market indices, characterized by high investor confidenceLongby Humble_HunterUpdated 110
saudi steel pip is to hold more and morehello investors Dear 1320 investors you should hold your shares because saudi steel pip will, if breaks up its higher high price(93$), reach its 134$ as a first target in few mounths. why? because as we broke out its long corridor now it is in its first breath so 134$ will be its plenty first breath, and this reversing down is just a kind of pullback on its oblic corridor trendup, so do not be affraid of it you can buy additional shares. remember i do not have a cristal ball predicting matrkets moves but i try to be more rational and efficient. nb: if you need some markets analysis just mention it, if you like my analysis please give me some push in order to encourage me good luckLongby HASSOUNI-trading2
Play on LevelsImmediate Resistance is around 75.50 - 76. Crossing & Sustaining 75.70 will lead it towards 77 -78. It will be in uptrend once it sustains 80.by House-of-Technicals0
Buy if..Bullish Divergence on Weekly TF. Immediate Resistance is around 83 - 84. However, Crossing & Sustaining 87.50 may lead it towards 98 - 99.by House-of-Technicals1
Buy Bullish Divergence on Daily as well as Weekly TF. Double Bottom Formation. Buy Above 2.95 (if Sustained) Sell around 3.25 - 3.30 Stoploss 2.60 (Closing basis)by House-of-Technicals442
Bearish AlrajhiI see huge resistance as the chart , i predict that the price will go down if it touches the Resistance levelShortby Abdullahzc90
4240 Fawaz Abdulaziz al hukair4240 Fawaz Abdulaziz al hukair takenout buyside liqudity market structure shift create fvg brker minimum equals highs is target. taek your own risk.Longby Asif_Brain_Waves1
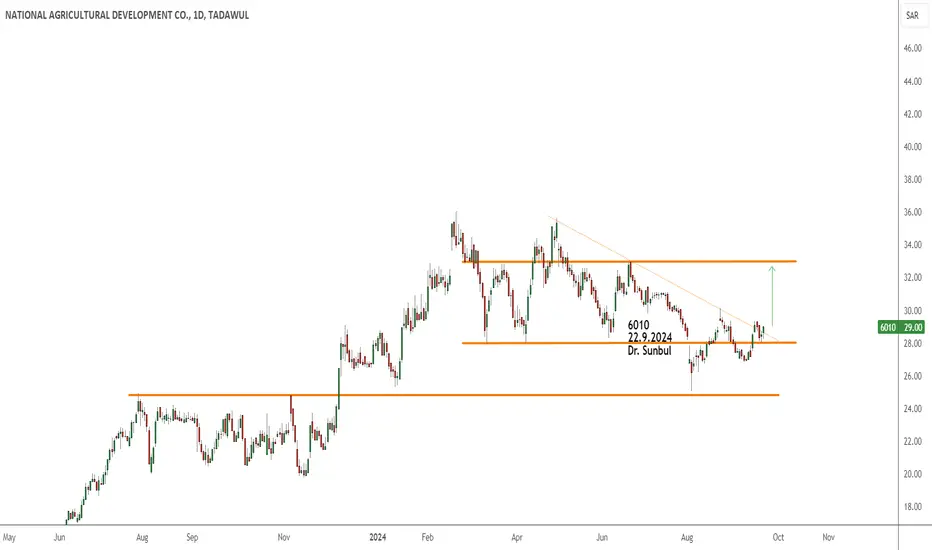
6010 NADECHello traders, The National Agricultural Development Company (NADEC) is one of the clear companies in Saudi market. Now: 29 with stop loss: 28 and the next target is 32.6 SAR. Good luck for allLongby Dr_Mohammed_Sunbul0
Saudi arabian mining still uphello dear investors buyers should keep this stock on their portfolio because it is just a preparation of explosion toward skys 60/65 then 84$ so stay optimistic you will get wealthy, so do not be greed just give me piece of your cake remember i do not have a cristal ball prediction stocks future but i try to be more rationnal. Good lluckLongby HASSOUNI-trading1
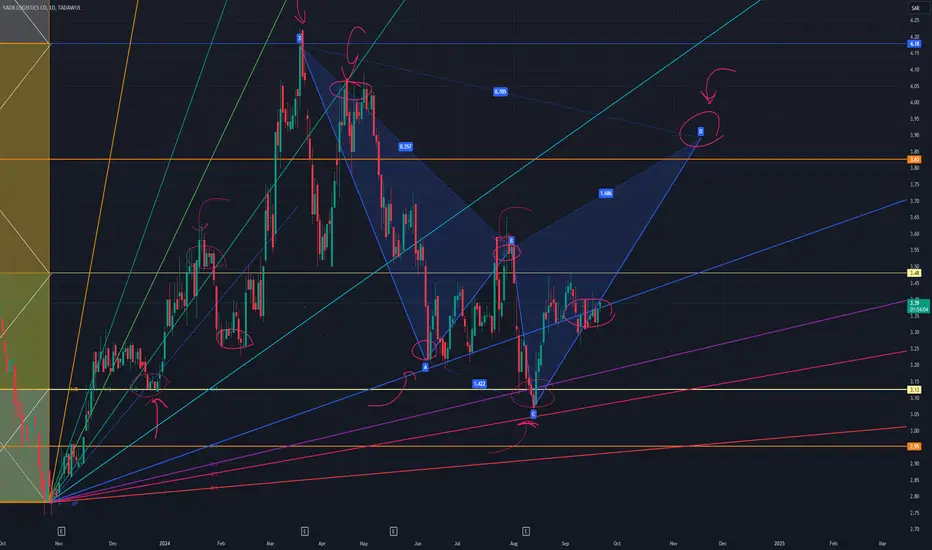
using gann and harmonic methods to findout the prrice targettrying to findout the target of the price and the support using gann method and that includes drwing a squere that represent the higest and lowest price then work around to find the price target and support,by Mr_Analyst12
IMPORTANT TO SUSTAIN 59.70 ON MONTHLY BASIS Important To Sustain 59.70 On Monthly Basis. Entry Can Be Taken With A Stoploss Of 55.90 Immediate Resistance Is Around 62 - 62.50 by House-of-Technicals3
UpdateBullish Engulfer followed by Bullish Pin Bar (Very Positive Trigger for Upside). 67.80 is a resistance for now; which if Sustained on Monthly basis. by House-of-Technicals2
2310 IS GOING BEARISHAnother market that people are asking about is 2310. Don't buy it, and if you have already bought and you're in losses close your positions and wait for the market to give you a proper entry and take it! Let me know which market you have bought in losses!Shortby YassineAnalysis2
WAIT BEFORE YOU BUY 2040As you can notice on the chart, the market still got some gaps to fill before going Bullish. To buy on 2040 you must wait for the market to fill all the gaps then you can have a safe entry. Let me know the stocks you're holding in losses.Shortby YassineAnalysis1
DON'T WASTE YOUR MONEY ON 2222A month ago I posted not to buy on 2222, but still some people have bought and cashed out all their savings, and some are still in big losses. The stock is still heading down. DO NOT BUY IT! Let me know the stocks you have bought for loss!Shortby YassineAnalysis995
DON'T BUY 1120Been receiving too many questions about 1120 if it's time to buy it, I can say no since the market gave us a failure swing and now it's heading to the FVG we have to fill it. Don't buy it and instead invest in the stocks that will come you with profits. Follow for more!Shortby YassineAnalysis2
2190 I think the main stock trend is down, but it can be used to make a quick profit of 10%.Longby hamza66s112
Review of Nayifat Finance Co's Analysis 4081 Nayifat Finance Co. has demonstrated a robust analytical approach in their recent market assessment. Their focus on key trading concepts, including sell-side liquidity, buy-side liquidity, and market structure shifts, reflects a comprehensive understanding of market dynamics. Sell-Side Liquidity Analysis: The company effectively identified the 4081 level where sell-side liquidity was taken out. This precise observation is crucial for understanding potential market shifts and making informed trading decisions. Monthly Target Achievement: Nayifat Finance Co. set a clear monthly target, aligning their strategies with the broader market objectives. Their ability to achieve this target suggests a well-executed plan and accurate market predictions. Buy-Side Liquidity Focus: The assessment of buy-side liquidity and the creation of Fair Value Gaps (FVGs) demonstrate an in-depth analysis of market trends. This approach helps in identifying potential buying opportunities and market entry points. Market Structure Shifts: The identification of a market structure shift is a critical component of their analysis. This insight into structural changes within the market is essential for adjusting strategies and capitalizing on new opportunities. Projection Deviation and Confirmation: The company's projection deviations were well-conceived, with confirmation of targets enhancing the reliability of their predictions. This aspect underscores their ability to adapt and refine strategies based on evolving market conditions. Overall, Nayifat Finance Co. has provided a thorough and insightful review of market dynamics, showcasing their expertise in forex trading and technical analysis. Their methodical approach to liquidity analysis and market structure shifts positions them as a strong player in the financial sector.Longby Asif_Brain_WavesUpdated 2
Al Yamamah Steel Industries - ksa - Long-term We expect the stock to enter an accumulation phase at its current levels, followed by movement towards the targets outlined below. This is supported by improved business results, increased production capacity, and a boost to the construction sector due to interest rate cuts. Although several financial factors are currently affecting the stock, we foresee the possibility of improved financial performance and recovery by the first half of 2025. Longby Fares-egy2
Beautiful Bullish Engulfing Candle on Weekly Basis.Beautiful Bullish Engulfing Candle on Weekly Basis. 55.50 is an Important level that should be sustained on Monthly basis. However, 59.30 - 62 is the Resistance range. 52 should be the Stoploss for now.by House-of-Technicals0
 LongLong
 Long
Long Long
Long Long
Long Long
Long


 Short
Short Long
Long Long
Long Long
Long


 Short
Short Short
Short ShortShort
 Long
Long Long
Long Long
Long