Potential Trend Reversal ongoing13-12-2025
expected Trend reversal ongoing
on higher TF
made a new high at 9.48
took support near 7 at 78% fib retracement level
HH/HL pattern on hourly TF
good volume on the rally while dried volume on the retracement
accumulate near 7 with tigh SL below 7
TP1: 7.6
TP2: 8.1
TP3: 8.6
crossing and sustaining above 9.5 will confirm trend reversal
#This is an analysis for learning purposes, not a financial / investment advice
Possible Trend reversal ongoing13-Dec-2025
Possible trend reversal ongoing
good volume on the upward rally, dried volume on the retracement, price retraced to FIB level 78% so far.
6.55 to 6.39 would be best buying zone for swing trade. SL 6.35 on closing basis for a target 7.2 for now. closing above 7.26 would confirm the idea of trend reversal
6070 - AL JOUF26-03-2026
Closed today @ 52.55
Bullish Divergence on weekly TF is in play
Also created Double bottom with neckline retested already
Good entry between 51.6 - 52.4
1st Target 54.1
2nd Target 55.5
Stoploss 50.8 on closing basis
In long term Sustaining above 56 will open 70 as target for previous butterfly pattern
6004 - Bullish divergence at strong support zone6004, in strong support zone, extremely low risk entry near 68. as long as it stays above 67 it can rebound from here. bullish divergence formed on daily TF, likely it will rebound.
TP1: 75
TP2 84 and bullish reversal level.
It can stay below 70 for some days, but key is to stay above 67 (SL)
Rectangular Channel4200 Analysis
Closed at 130.90 (25-03-2026)
Currently trading in a rectangular channel; ranging from 110 - 155.
Also, 113 - 114 is 38.20% fib retracement level of entire rally & it seems
it has taken support from this level.
Monthly closing above 118 - 120 would be a +ve sign.
Breaking 110 may bring somewhat more selling pressure.
Tadawul Stock (1150) – Potential Continuation Setup After Struct📊 Tadawul Stock (1150) – Alinma Bank
This setup is developing after a clear shift in market structure, where price has transitioned from a bearish phase into early signs of bullish intent.
🔍 Market Structure Breakdown
Multiple CHoCH (Change of Character) signals indicate a transition from distribution to accumulation
A confirmed BOS (Break of Structure) to the upside suggests buyers are stepping in
Price is now trading around the 200 EMA, which is acting as a key dynamic level
⚡ Current Scenario
Price is consolidating just below a minor resistance / liquidity zone
The structure suggests a potential continuation move toward the higher time frame target
The highlighted zone above represents a high-probability expansion area
🎯 Trade Plan
Entry Zone: Around current consolidation / slight pullback
Invalidation: Below recent structure low (risk clearly defined)
Target: Higher time frame resistance (~32.60 zone)
This provides a clean asymmetric RR setup, aligned with structure and momentum.
🧠 Strategic Context
This is not a random trade — it aligns with:
Sector-level strength (Energy showing early recovery signs)
Structural shift on higher time frame
Momentum building above key moving average
⚠️ Important Note
This setup requires confirmation on lower time frames.
Avoid chasing — let the market come into your zone.
📌 Tadawul Insight
If you’re actively trading the Saudi market, follow for structured analysis and sector-based opportunities.
More insights like this are shared under Tadawul Insight, focused on high-probability setups and market flow.
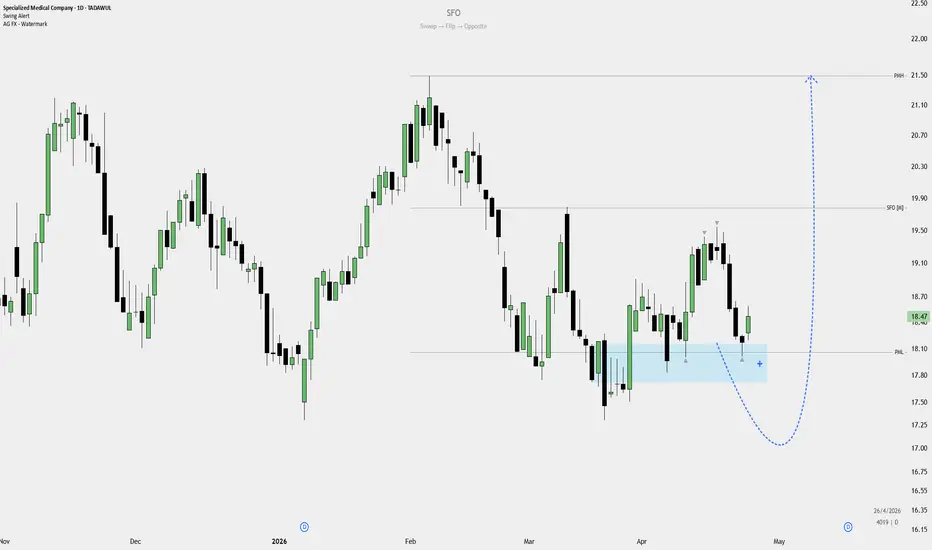
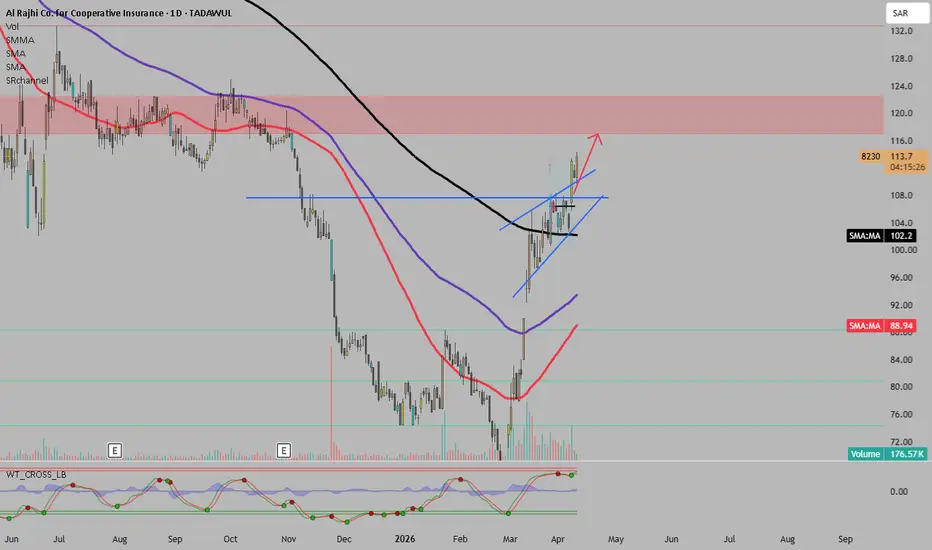
al rajhi co insurance 8230 Buy Setup – 22 March 2026Asif Brain Waves #01 – SFO Buy Idea – 22 March 2026
Bias: Bullish (after strong displacement from lows)
SFO Logic:
Sweep: Downtrend liquidity already taken
Flip: Strong bullish candle → structure shift near 98–101
Opposite: Target EQH liquidity at 124.8
Entry Idea:
Wait for pullback into 90–95 zone (FVG / discount)
Confirm with bullish hold + continuation
Enter on second push (clean flip confirmation)
Stop Loss:
Below recent low (~78–80)
Targets:
TP1: 101 (structure)
TP2: 110–115 (internal highs)
Final TP: 124.8 (liquidity)
Key Rule:
No pullback = no trade
Follow the flow → Sweep → Flip → Opposite
Simple View:
Let price retrace, then ride the move toward liquidity.
2010 saudi basit industries corp Buy Setup – 22 March 2026**Buy Trade Plan (SFO – Sweep → Flip → Opposite)**
* **Bias:** Bullish (strong reaction from demand zone ~50)
**SFO Flow:**
* **Sweep:** Sell-side liquidity taken from lows
* **Flip:** Strong bullish move + structure shift above 57
* **Opposite:** Target EQH liquidity at **64**
---
**Entry Plan:**
* Wait for **pullback into 53–55 zone (discount / FVG area)**
* Confirm with **bullish structure + FVG hold (M15–H1)**
* Take **second entry after clean flip**
**Stop Loss:**
* Below demand zone (~50)
**Targets:**
* TP1: 57 (structure level)
* TP2: 60 (internal high)
* Final TP: **64 (EQH liquidity)**
---
**Execution Rule:**
* No pullback = No trade
* Follow model strictly → **Sweep → Flip → Opposite**
**Simple View:**
Buy the dip after flip → ride towards liquidity above.
Bupa Arabia for cooperative co 22 march 2026**Buy Trade Plan (SFO – Sweep → Flip → Opposite)**
* **Bias:** Bullish (sell-side liquidity already swept at 135.4)
**Concept (SFO):**
* **Sweep:** Liquidity taken below lows
* **Flip:** Market shifts bullish (structure break + FVG)
* **Opposite:** Target buy-side liquidity above
---
**Entry Plan:**
* Wait for **pullback into 147–155 zone (discount area)**
* Look for **bullish FVG + structure shift (M15–H1)**
* Enter on **second confirmation (clean flip)**
**Stop Loss:**
* Below sweep low (135.4)
**Targets:**
* TP1: ~175 (mid range)
* TP2: ~195 (internal highs)
* Final TP: **215 (buy-side liquidity)**
---
**Execution Rule:**
* No confirmation = No trade
* Follow full model → **Sweep → Flip → Opposite (target liquidity)**
**Mindset:**
Don’t chase. Let market come to your zone, then execute clean.
Long Consolidation box.2110 Analysis
Closed at 165.10 (16-03-2026)
Long Consolidation box.
Currently around resistance level (170 - 175).
Crossing this range may lead it towards 200 - 210
initially.
Immediate Support seems to be around 151 - 153
& then around 140 - 141.
However, breaking 125 - 126 may bring more selling
pressure.
Consolidation range bottom is around 56 - 60.
Company for Cooperative Insurance (Tawuniya) 8010Greetings, fellow traders.
I will be analyzing The Company for Cooperative Insurance (Tawuniya) (8010), the undisputed heavyweight of the Saudi insurance sector, which continues to hit record-breaking historical levels alongside the broader market surge.
Technical Overview:
Tawuniya’s stock has shown remarkable bullish momentum, recently touching all-time highs as it breaks out of long-term consolidation phases. The technical pattern reflects strong institutional confidence, with the stock consistently trading above its key moving averages.
Financially:
The company’s performance is nothing short of powerhouse status. Tawuniya reported a 10.6% increase in net profit for the 2025 fiscal year, reaching SAR 1.2 billion. This growth is backed by massive scale, with insurance revenues exceeding SAR 18 billion.
Ratings & Partnerships:
Ratings: It maintains a dominant credit profile with an "A" rating from Fitch (Positive Outlook) and an "A-" from S&P Global, reflecting its superior market position and capital adequacy.
The PIF Factor: While not directly owned by the PIF like Saudi Re, Tawuniya is the primary insurer for the Kingdom's Giga-projects (such as NEOM and Red Sea Global). This strategic role effectively makes it a core partner in the Vision 2030 economic transformation.
I'd love to hear your perspective on whether this "blue chip" still has room to run or if we are approaching a cooling-off period.
Best regards.
Walaa Cooperative Insurance Company SJSC 8060Greetings, fellow traders.
I will be analyzing the Saudi insurance sector, as most of its stocks have recently reached record-breaking historical levels.
A notable example is Walaa Cooperative Insurance Company SJSC (8060). The technical pattern developing on this chart is quite evident.
Financially:
It remains the 3rd largest insurer in the Saudi General Insurance (non-life) market, commanding a 17% market share in that specific sector.
Moody’s: 'A3' insurance financial strength rating (IFSR) with a Stable outlook.
S&P Global: Currently holds an 'A-' financial strength rating. However, S&P recently revised the outlook from "Stable" to "Negative" due to underperformance relative to its regional peers
I'd love to hear your perspective on this setup.
Best regards.
Aljazira Takaful Taawuni Company 8012Greetings, fellow traders.
I will be analyzing the Saudi insurance sector, as most of its stocks have recently reached record-breaking historical levels.
A notable example is Aljazira Takaful Taawuni Company (8012). The technical pattern developing on this chart is quite evident.
Financially: : Analysts are watching for continued growth in its motor and group credit insurance segments, following large contract renewals with Bank Aljazira in late 2025 (valued at SAR 69 million).
I'd love to hear your perspective on this setup.
Best regards.
Saudi Reinsurance Company 8200Greetings, fellow traders.
I will be analyzing the Saudi insurance sector, as most of its stocks have recently reached record-breaking historical levels.
A notable example is Saudi Reinsurance Company (8200). The technical pattern developing on this chart is quite evident.
Financially: Strong performance led to a rating upgrade by Moody's to "A2" (Stable) and an affirmation from S&P Global at "A-". The Public Investment Fund (PIF) a strategic partner.
I'd love to hear your perspective on this setup.
Best regards.
8180Greetings, fellow traders.
I will be analyzing the Saudi insurance sector, as most of its stocks have recently reached record-breaking historical levels.
A notable example is Al Sagr Insurance (8180). The technical pattern developing on this chart is quite evident.
Financially: The company remains unprofitable with a negative Earnings Per Share (EPS) of -1.43. However, it maintains a stable "BBB" financial strength rating from Fitch Ratings.
I'd love to hear your perspective on this setup.
Best regards.
Potential Long Setup on Retal Urban Development Company - 4322The chart of Retal Urban Development Company (Tadawul: 4322) shows that the stock has been trading under a well-defined downward trend. After an extended decline, price action recently produced a corrective move and is now approaching a key confirmation zone, where a Fair Value Gap (FVG) is also present.
This area aligns closely with the descending trendline resistance that has been controlling the market structure for several months. If the price manages to stabilize and confirm above this zone, it could signal the beginning of a bullish recovery phase.
From this confirmation level, the next logical target lies in the higher-timeframe high-volume zone around the 16.5–17 SAR region, which represents the nearest major liquidity area.
Based on this structure, the setup currently offers a risk-to-reward profile close to 1:3, with downside risk defined below the recent support area near 11 SAR. If the confirmation holds, the projected move toward the higher liquidity zone could realistically unfold within the next four to five weeks.
In addition to the visible price structure, several proprietary indicators I use privately are also indicating similar conditions. However, these tools are part of my personal trading framework and are not shared publicly.
Flynas Co. – Buy Plan After Liquidity Grab 8-March 22026 1st quaPrice has already grabbed sell-side liquidity by sweeping the recent lows, which often indicates that weak sellers have been taken out. After such a liquidity grab, the market usually looks to move toward buy-side liquidity resting above the highs.
My plan is to wait for price to break the first swing high to confirm bullish strength. A break of that high would signal that buyers are stepping in and the market may start targeting higher liquidity levels.
Buy Plan:
Wait for a clean break above the first swing high.
Look for a buy entry after the breakout or on a small pullback.
Targets:
1st Target: Around 57.00 area
2nd Target: Around 64.45 liquidity level
Final Target: Around 81.70 buy-side liquidity
Logic:
Sell-side liquidity grabbed → Market shifts bullish → Break of swing high → Target buy-side liquidity above.