Smart Money Liquidity Structure [TradingFinder] OB Signal Setups
More exclusive indicators from TradingFinder
Subscribe to TFlab [TradingFinder] Pro Trading Toolkits for $48.88/month to get exclusive indicators by this author. You pay right on TradingView and can use them on your charts straight away.
Explore TFlab [TradingFinder] Pro Trading Toolkits🔵Introduction
Every significant price movement begins with a shift in the balance between buyers and sellers, but the structure behind that movement often tells a more interesting story. As price establishes swing highs, swing lows, higher highs, and lower lows, it creates market structure patterns that traders use to identify potential liquidity concentrations and changes in market direction. Within Smart Money Concepts (SMC), these structural formations become particularly important when price approaches an order block, reacts to a liquidity level, or breaks a previously established swing point. Understanding the relationship between market structure, liquidity, and order blocks can reveal potential trading opportunities that may remain hidden when analyzing price action through conventional support and resistance levels alone.

Liquidity does not always concentrate around obvious equal highs or equal lows. Throughout a bullish or bearish market structure, intermediate swing points can create additional liquidity levels that influence how price approaches a supply or demand zone. A market may develop several higher lows before revisiting a bullish order block, while a bearish structure can form successive lower highs before returning to a supply order block. These formations create different types of liquidity setups, where the number, position, and sequence of untouched liquidity levels provide valuable context. By examining single liquidity formations, two-level liquidity structures, and intermediate liquidity patterns, traders can evaluate how price behavior develops around potential order blocks rather than treating every supply and demand zone as an isolated trading opportunity.
Market structure analysis becomes more meaningful when liquidity formations are examined alongside Break of Structure (BOS) events, swing reactions, and price displacement. A break above a structural high or below a structural low may indicate a change in directional momentum, but not every breakout carries the same significance. The strength of the breakout candle, the distance of the closing price beyond the broken structure, and the reaction around subsequent swing points help distinguish meaningful market structure developments from minor price fluctuations. Combining these elements with order block refinement and intermediate liquidity detection provides additional context for identifying bullish and bearish setups, particularly when price develops new liquidity levels during its movement away from an order block.
The interaction between price and an order block represents another important stage of liquidity-based market analysis. Once a bullish demand order block or bearish supply order block has been identified, the surrounding liquidity levels can be tracked until price reaches them or the associated structure loses validity. Dynamic liquidity lines, refined order block boundaries, and bullish or bearish entry markers make these relationships visible directly on the price chart. The first return of price into an order block highlights a potential reaction area, although the interaction itself does not guarantee a reversal. Together, Smart Money Concepts, liquidity structure analysis, order block detection, BOS confirmation, and price action signals provide a comprehensive framework for evaluating how liquidity develops, how market structure evolves, and where potential trading setups may emerge.
🔵How to Use
Understanding how liquidity interacts with market structure is essential when analyzing potential order block trading opportunities. Price frequently moves through sequences of swing highs and swing lows, creating liquidity levels that may influence the direction and strength of subsequent movements. Within Smart Money Concepts (SMC), these formations provide context for identifying supply and demand order blocks, potential liquidity targets, and structural changes in price action. Rather than treating every order block as an immediate trading opportunity, traders can examine how price develops around liquidity levels, whether those levels remain untouched, and how the market behaves when returning to an identified order block. The combination of liquidity structure, order block detection, and price interaction signals creates a more comprehensive view of potential bullish and bearish trading setups.
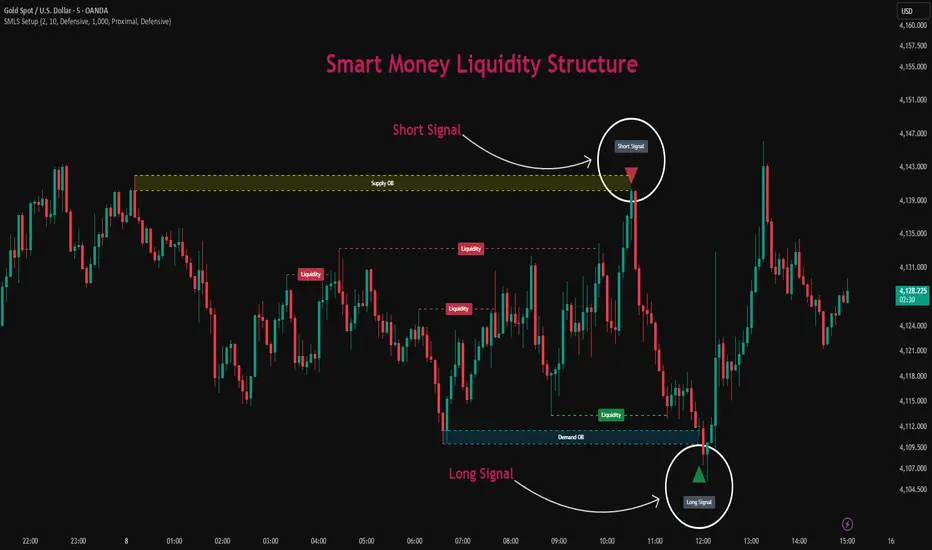
The analysis incorporates three independent liquidity setup models, each capturing a different relationship between market structure and order blocks. The One Liquidity Setup identifies formations containing a single valid liquidity level, while the Two Liquidity Setup focuses on structures containing two distinct liquidity levels. The Midway Liquidity Setup extends the analysis by identifying intermediate liquidity formations that develop following a Break of Structure (BOS), supported by additional swing and structural quality conditions. Traders can activate these models individually or simultaneously, depending on their preferred analytical approach. Once a valid setup is identified, its corresponding bullish demand or bearish supply order block appears on the chart alongside the associated liquidity levels. Horizontal liquidity lines extend until price reaches them or the order block loses validity, while directional signal markers highlight the first subsequent interaction between price and the identified order block.
🟣Long Signals
A bullish Smart Money setup develops when the price structure suggests a potential demand area where buyers may become active again. The analysis begins with identifying the relationship between recent swing highs, swing lows, and higher-low formations. In a bullish market structure, price may establish a sequence of higher highs and higher lows while leaving liquidity below intermediate swing points. These untouched liquidity levels can become important reference points during a subsequent pullback toward a bullish order block. When the structural conditions are satisfied, a Demand Order Block is identified and displayed as a horizontal zone, with its boundaries indicating the proximal and distal limits of the potential demand area.
🟣One Liquidity Setup
This bullish formation focuses on a valid market structure containing one untouched liquidity level associated with a demand order block. The algorithm evaluates the sequence of structural pivots and identifies a qualifying swing low positioned above the order block. This liquidity level is represented by a horizontal green line with a Liquidity label. As long as the level remains untouched and the associated order block remains valid, the line continues extending to the right. This setup is particularly useful when a bullish structure develops with fewer intermediate swing points, allowing potential order block trading opportunities to be identified without requiring multiple liquidity levels.

🟣Two Liquidity Setup
In more developed bullish structures, two distinct liquidity levels may emerge before price revisits the demand order block. These levels are derived from the underlying swing structure and must satisfy the conditions required for untouched liquidity. Two horizontal liquidity lines appear at their respective prices, providing a visual representation of the liquidity structure associated with the bullish setup. The relationship between these levels can help traders evaluate how a pullback progresses through the market structure. The two levels are treated independently, meaning that when price reaches one liquidity level, its extension stops without automatically terminating the other. Their separation must also satisfy the minimum liquidity gap requirement, helping distinguish two separate structural levels from closely clustered price points.

🟣Midway Liquidity Setup
Some bullish opportunities develop outside conventional single-level or two-level structural patterns. In these situations, a confirmed bullish Break of Structure can establish the initial context for a potential demand order block. The algorithm evaluates the strength of the breakout through the closing distance beyond the previous structural high and the size of the bullish candle body relative to Average True Range (ATR). Following the breakout, the market must establish a qualifying intermediate swing low above the demand order block. The swing reaction, order block characteristics, and structural conditions contribute to a quality assessment before the setup becomes valid. Additional untouched intermediate liquidity levels may subsequently be recognized, allowing the trader to observe how liquidity develops during the continuation of the bullish structure.

🟣Short Signals
A bearish Smart Money setup represents the opposite structural environment, where price action suggests a potential supply area and the possibility of renewed selling pressure. The analysis focuses on swing highs, swing lows, lower highs, and lower lows to evaluate the development of bearish market structure. During downward price movements, temporary bullish retracements can establish intermediate swing highs that may contain untouched buy-side liquidity. These levels become relevant when price approaches a bearish order block, particularly when the broader market structure supports the possibility of a downward reaction. Once the required structural conditions are met, a Supply Order Block appears on the chart, marking the potential supply zone associated with the setup.
🟣One Liquidity Setup
This bearish formation identifies a qualifying structure containing a single untouched liquidity level below the associated supply order block. The level generally originates from a structural swing high and is displayed through a horizontal red liquidity line. Its position provides a reference for understanding the relationship between the current price structure and the potential supply zone. As long as the level remains untouched and the order block remains valid, the liquidity line continues extending. This setup allows traders to identify potential bearish order block opportunities in structures that do not contain multiple qualifying liquidity levels.

🟣Two Liquidity Setup
A more developed bearish structure may contain two separate liquidity levels originating from intermediate swing highs. These levels reflect different points within the bearish market structure and can provide additional context for evaluating how price approaches a supply order block. When both levels satisfy the structural, freshness, and separation conditions, two red horizontal liquidity lines are displayed. Each line extends independently until its corresponding level is reached by price or the associated order block loses validity. Monitoring these levels allows traders to follow changes in the liquidity structure without assuming that every interaction necessarily produces an immediate bearish reversal.

🟣Midway Liquidity Setup
In bearish market conditions, intermediate liquidity can also develop following a confirmed downside Break of Structure. The algorithm first evaluates whether price has broken below a relevant structural low with sufficient bearish displacement and closing strength. A potential supply order block is then associated with the structural break. Subsequent swing highs below the supply zone are examined to determine whether they represent untouched intermediate liquidity levels. ATR-based swing reactions, the characteristics of the order block, the strength of the bearish breakout, and the development of the price structure contribute to the setup's quality assessment. This additional evaluation helps distinguish qualifying midway liquidity formations from smaller market fluctuations that may have limited structural significance.

After a bearish supply order block is identified, the subsequent return of price toward the zone becomes the main point of observation. During this movement, liquidity levels may be reached, causing their corresponding lines to stop extending at the first wick interaction. When price first enters the active supply order block after its creation, a red downward-pointing triangle appears above the relevant candle, accompanied by a silver Short Signal label positioned above the triangle. The signal highlights the first price interaction with the supply zone and should not be interpreted as proof that a bearish reversal has occurred. Traders can evaluate the reaction through bearish price action, rejection candles, structural continuation, and the relationship between price and the order block boundaries before considering a short trade.
The effectiveness of bullish and bearish liquidity analysis depends on interpreting these elements as parts of the same market structure rather than isolated signals. A valid order block identifies a potential area of interest, untouched liquidity levels provide context for the surrounding price structure, and the Long Signal or Short Signal indicates when price has returned to that area. The quality of the subsequent reaction remains dependent on market conditions, volatility, and the broader price environment. By combining Smart Money Concepts, liquidity structure analysis, bullish and bearish order blocks, and price action confirmation, traders can develop a more systematic approach to identifying and evaluating potential trading opportunities.
🔵Settings
One & Two Setup Pivot Period: Adjusts the pivot sensitivity for detecting single-level and two-level liquidity structures.
Midway Liquidity Setup Pivot Period: Controls the swing detection sensitivity for intermediate liquidity setups.
One Liquidity Setup: Enables or disables setups containing a single valid liquidity level.
Two Liquidity Setup: Enables or disables setups containing two distinct liquidity levels.
Midway Liquidity Setup: Activates liquidity setups based on Break of Structure (BOS) and intermediate swing formations.
Midway Liquidity Mode: Selects Aggressive, Moderate, or Defensive detection based on structural confirmation and setup quality.
OB Validity (Bars From Origin): Defines the maximum number of candles an order block remains valid from its origin.
OB Mitigation Level: Determines the mitigation threshold using Proximal, 50% OB, or Distal levels.
Refine OB: Enables or disables order block refinement for more precise supply and demand zones.
Refinement Mode: Selects Aggressive or Defensive refinement to adjust order block boundaries.
Show Order Blocks: Shows or hides bullish demand and bearish supply order blocks.
Demand: Customizes the color of bullish demand order blocks.
Supply: Customizes the color of bearish supply order blocks.
Show Liquidity: Enables or disables liquidity level visualization.
Bullish: Adjusts the color of bullish liquidity lines.
Bearish: Adjusts the color of bearish liquidity lines.
Show Liquidity Text: Shows or hides Liquidity labels on horizontal liquidity levels.
Show OB Entry Signals: Enables or disables Long Signal and Short Signal markers at the first price interaction with an order block.
🔵Conclusion
Understanding the relationship between liquidity, market structure, and order blocks provides a more comprehensive perspective on how price movements develop across financial markets. Within the Smart Money Concepts (SMC) framework, swing highs, swing lows, untouched liquidity levels, and Break of Structure (BOS) formations offer valuable insights into potential supply and demand areas. By combining single-level liquidity setups, two-level liquidity structures, and intermediate liquidity formations, traders can identify different types of bullish and bearish order block setups while evaluating the structural conditions surrounding each opportunity. The integration of order block refinement, liquidity tracking, and quality-based detection helps distinguish meaningful price formations from ordinary market fluctuations.
A structured approach to Smart Money trading, liquidity analysis, and order block identification allows traders to move beyond isolated buy and sell signals and examine the broader context of price action. Dynamic liquidity levels highlight potential areas of interest, while Long Signal and Short Signal markers identify the first interaction between price and a valid order block. These interactions represent potential trading opportunities rather than guaranteed reversals, making additional price action confirmation and risk management essential. By interpreting liquidity structures alongside market direction, structural breaks, and supply and demand zones, traders can develop a more consistent and informed approach to analyzing market behavior and evaluating potential trading setups.
Every significant price movement begins with a shift in the balance between buyers and sellers, but the structure behind that movement often tells a more interesting story. As price establishes swing highs, swing lows, higher highs, and lower lows, it creates market structure patterns that traders use to identify potential liquidity concentrations and changes in market direction. Within Smart Money Concepts (SMC), these structural formations become particularly important when price approaches an order block, reacts to a liquidity level, or breaks a previously established swing point. Understanding the relationship between market structure, liquidity, and order blocks can reveal potential trading opportunities that may remain hidden when analyzing price action through conventional support and resistance levels alone.
Liquidity does not always concentrate around obvious equal highs or equal lows. Throughout a bullish or bearish market structure, intermediate swing points can create additional liquidity levels that influence how price approaches a supply or demand zone. A market may develop several higher lows before revisiting a bullish order block, while a bearish structure can form successive lower highs before returning to a supply order block. These formations create different types of liquidity setups, where the number, position, and sequence of untouched liquidity levels provide valuable context. By examining single liquidity formations, two-level liquidity structures, and intermediate liquidity patterns, traders can evaluate how price behavior develops around potential order blocks rather than treating every supply and demand zone as an isolated trading opportunity.
Market structure analysis becomes more meaningful when liquidity formations are examined alongside Break of Structure (BOS) events, swing reactions, and price displacement. A break above a structural high or below a structural low may indicate a change in directional momentum, but not every breakout carries the same significance. The strength of the breakout candle, the distance of the closing price beyond the broken structure, and the reaction around subsequent swing points help distinguish meaningful market structure developments from minor price fluctuations. Combining these elements with order block refinement and intermediate liquidity detection provides additional context for identifying bullish and bearish setups, particularly when price develops new liquidity levels during its movement away from an order block.
The interaction between price and an order block represents another important stage of liquidity-based market analysis. Once a bullish demand order block or bearish supply order block has been identified, the surrounding liquidity levels can be tracked until price reaches them or the associated structure loses validity. Dynamic liquidity lines, refined order block boundaries, and bullish or bearish entry markers make these relationships visible directly on the price chart. The first return of price into an order block highlights a potential reaction area, although the interaction itself does not guarantee a reversal. Together, Smart Money Concepts, liquidity structure analysis, order block detection, BOS confirmation, and price action signals provide a comprehensive framework for evaluating how liquidity develops, how market structure evolves, and where potential trading setups may emerge.
🔵How to Use
Understanding how liquidity interacts with market structure is essential when analyzing potential order block trading opportunities. Price frequently moves through sequences of swing highs and swing lows, creating liquidity levels that may influence the direction and strength of subsequent movements. Within Smart Money Concepts (SMC), these formations provide context for identifying supply and demand order blocks, potential liquidity targets, and structural changes in price action. Rather than treating every order block as an immediate trading opportunity, traders can examine how price develops around liquidity levels, whether those levels remain untouched, and how the market behaves when returning to an identified order block. The combination of liquidity structure, order block detection, and price interaction signals creates a more comprehensive view of potential bullish and bearish trading setups.
The analysis incorporates three independent liquidity setup models, each capturing a different relationship between market structure and order blocks. The One Liquidity Setup identifies formations containing a single valid liquidity level, while the Two Liquidity Setup focuses on structures containing two distinct liquidity levels. The Midway Liquidity Setup extends the analysis by identifying intermediate liquidity formations that develop following a Break of Structure (BOS), supported by additional swing and structural quality conditions. Traders can activate these models individually or simultaneously, depending on their preferred analytical approach. Once a valid setup is identified, its corresponding bullish demand or bearish supply order block appears on the chart alongside the associated liquidity levels. Horizontal liquidity lines extend until price reaches them or the order block loses validity, while directional signal markers highlight the first subsequent interaction between price and the identified order block.
🟣Long Signals
A bullish Smart Money setup develops when the price structure suggests a potential demand area where buyers may become active again. The analysis begins with identifying the relationship between recent swing highs, swing lows, and higher-low formations. In a bullish market structure, price may establish a sequence of higher highs and higher lows while leaving liquidity below intermediate swing points. These untouched liquidity levels can become important reference points during a subsequent pullback toward a bullish order block. When the structural conditions are satisfied, a Demand Order Block is identified and displayed as a horizontal zone, with its boundaries indicating the proximal and distal limits of the potential demand area.
🟣One Liquidity Setup
This bullish formation focuses on a valid market structure containing one untouched liquidity level associated with a demand order block. The algorithm evaluates the sequence of structural pivots and identifies a qualifying swing low positioned above the order block. This liquidity level is represented by a horizontal green line with a Liquidity label. As long as the level remains untouched and the associated order block remains valid, the line continues extending to the right. This setup is particularly useful when a bullish structure develops with fewer intermediate swing points, allowing potential order block trading opportunities to be identified without requiring multiple liquidity levels.
🟣Two Liquidity Setup
In more developed bullish structures, two distinct liquidity levels may emerge before price revisits the demand order block. These levels are derived from the underlying swing structure and must satisfy the conditions required for untouched liquidity. Two horizontal liquidity lines appear at their respective prices, providing a visual representation of the liquidity structure associated with the bullish setup. The relationship between these levels can help traders evaluate how a pullback progresses through the market structure. The two levels are treated independently, meaning that when price reaches one liquidity level, its extension stops without automatically terminating the other. Their separation must also satisfy the minimum liquidity gap requirement, helping distinguish two separate structural levels from closely clustered price points.
🟣Midway Liquidity Setup
Some bullish opportunities develop outside conventional single-level or two-level structural patterns. In these situations, a confirmed bullish Break of Structure can establish the initial context for a potential demand order block. The algorithm evaluates the strength of the breakout through the closing distance beyond the previous structural high and the size of the bullish candle body relative to Average True Range (ATR). Following the breakout, the market must establish a qualifying intermediate swing low above the demand order block. The swing reaction, order block characteristics, and structural conditions contribute to a quality assessment before the setup becomes valid. Additional untouched intermediate liquidity levels may subsequently be recognized, allowing the trader to observe how liquidity develops during the continuation of the bullish structure.
🟣Short Signals
A bearish Smart Money setup represents the opposite structural environment, where price action suggests a potential supply area and the possibility of renewed selling pressure. The analysis focuses on swing highs, swing lows, lower highs, and lower lows to evaluate the development of bearish market structure. During downward price movements, temporary bullish retracements can establish intermediate swing highs that may contain untouched buy-side liquidity. These levels become relevant when price approaches a bearish order block, particularly when the broader market structure supports the possibility of a downward reaction. Once the required structural conditions are met, a Supply Order Block appears on the chart, marking the potential supply zone associated with the setup.
🟣One Liquidity Setup
This bearish formation identifies a qualifying structure containing a single untouched liquidity level below the associated supply order block. The level generally originates from a structural swing high and is displayed through a horizontal red liquidity line. Its position provides a reference for understanding the relationship between the current price structure and the potential supply zone. As long as the level remains untouched and the order block remains valid, the liquidity line continues extending. This setup allows traders to identify potential bearish order block opportunities in structures that do not contain multiple qualifying liquidity levels.
🟣Two Liquidity Setup
A more developed bearish structure may contain two separate liquidity levels originating from intermediate swing highs. These levels reflect different points within the bearish market structure and can provide additional context for evaluating how price approaches a supply order block. When both levels satisfy the structural, freshness, and separation conditions, two red horizontal liquidity lines are displayed. Each line extends independently until its corresponding level is reached by price or the associated order block loses validity. Monitoring these levels allows traders to follow changes in the liquidity structure without assuming that every interaction necessarily produces an immediate bearish reversal.
🟣Midway Liquidity Setup
In bearish market conditions, intermediate liquidity can also develop following a confirmed downside Break of Structure. The algorithm first evaluates whether price has broken below a relevant structural low with sufficient bearish displacement and closing strength. A potential supply order block is then associated with the structural break. Subsequent swing highs below the supply zone are examined to determine whether they represent untouched intermediate liquidity levels. ATR-based swing reactions, the characteristics of the order block, the strength of the bearish breakout, and the development of the price structure contribute to the setup's quality assessment. This additional evaluation helps distinguish qualifying midway liquidity formations from smaller market fluctuations that may have limited structural significance.
After a bearish supply order block is identified, the subsequent return of price toward the zone becomes the main point of observation. During this movement, liquidity levels may be reached, causing their corresponding lines to stop extending at the first wick interaction. When price first enters the active supply order block after its creation, a red downward-pointing triangle appears above the relevant candle, accompanied by a silver Short Signal label positioned above the triangle. The signal highlights the first price interaction with the supply zone and should not be interpreted as proof that a bearish reversal has occurred. Traders can evaluate the reaction through bearish price action, rejection candles, structural continuation, and the relationship between price and the order block boundaries before considering a short trade.
The effectiveness of bullish and bearish liquidity analysis depends on interpreting these elements as parts of the same market structure rather than isolated signals. A valid order block identifies a potential area of interest, untouched liquidity levels provide context for the surrounding price structure, and the Long Signal or Short Signal indicates when price has returned to that area. The quality of the subsequent reaction remains dependent on market conditions, volatility, and the broader price environment. By combining Smart Money Concepts, liquidity structure analysis, bullish and bearish order blocks, and price action confirmation, traders can develop a more systematic approach to identifying and evaluating potential trading opportunities.
🔵Settings
One & Two Setup Pivot Period: Adjusts the pivot sensitivity for detecting single-level and two-level liquidity structures.
Midway Liquidity Setup Pivot Period: Controls the swing detection sensitivity for intermediate liquidity setups.
One Liquidity Setup: Enables or disables setups containing a single valid liquidity level.
Two Liquidity Setup: Enables or disables setups containing two distinct liquidity levels.
Midway Liquidity Setup: Activates liquidity setups based on Break of Structure (BOS) and intermediate swing formations.
Midway Liquidity Mode: Selects Aggressive, Moderate, or Defensive detection based on structural confirmation and setup quality.
OB Validity (Bars From Origin): Defines the maximum number of candles an order block remains valid from its origin.
OB Mitigation Level: Determines the mitigation threshold using Proximal, 50% OB, or Distal levels.
Refine OB: Enables or disables order block refinement for more precise supply and demand zones.
Refinement Mode: Selects Aggressive or Defensive refinement to adjust order block boundaries.
Show Order Blocks: Shows or hides bullish demand and bearish supply order blocks.
Demand: Customizes the color of bullish demand order blocks.
Supply: Customizes the color of bearish supply order blocks.
Show Liquidity: Enables or disables liquidity level visualization.
Bullish: Adjusts the color of bullish liquidity lines.
Bearish: Adjusts the color of bearish liquidity lines.
Show Liquidity Text: Shows or hides Liquidity labels on horizontal liquidity levels.
Show OB Entry Signals: Enables or disables Long Signal and Short Signal markers at the first price interaction with an order block.
🔵Conclusion
Understanding the relationship between liquidity, market structure, and order blocks provides a more comprehensive perspective on how price movements develop across financial markets. Within the Smart Money Concepts (SMC) framework, swing highs, swing lows, untouched liquidity levels, and Break of Structure (BOS) formations offer valuable insights into potential supply and demand areas. By combining single-level liquidity setups, two-level liquidity structures, and intermediate liquidity formations, traders can identify different types of bullish and bearish order block setups while evaluating the structural conditions surrounding each opportunity. The integration of order block refinement, liquidity tracking, and quality-based detection helps distinguish meaningful price formations from ordinary market fluctuations.
A structured approach to Smart Money trading, liquidity analysis, and order block identification allows traders to move beyond isolated buy and sell signals and examine the broader context of price action. Dynamic liquidity levels highlight potential areas of interest, while Long Signal and Short Signal markers identify the first interaction between price and a valid order block. These interactions represent potential trading opportunities rather than guaranteed reversals, making additional price action confirmation and risk management essential. By interpreting liquidity structures alongside market direction, structural breaks, and supply and demand zones, traders can develop a more consistent and informed approach to analyzing market behavior and evaluating potential trading setups.

💎Paid Space (VIP): tradingview.com/spaces/TradingFinder/
✅Telegram support team: t.me/TFLABS
🧠Free Forex, Crypto & Stock Trading tutorial, same as ICT, Smart Money & Price Action:
tradingfinder.com/education/forex/
✅Telegram support team: t.me/TFLABS
🧠Free Forex, Crypto & Stock Trading tutorial, same as ICT, Smart Money & Price Action:
tradingfinder.com/education/forex/
免责声明
这些信息和出版物并非旨在提供,也不构成TradingView提供或认可的任何形式的财务、投资、交易或其他类型的建议或推荐。请阅读使用条款了解更多信息。
💎Paid Space (VIP): tradingview.com/spaces/TradingFinder/
✅Telegram support team: t.me/TFLABS
🧠Free Forex, Crypto & Stock Trading tutorial, same as ICT, Smart Money & Price Action:
tradingfinder.com/education/forex/
✅Telegram support team: t.me/TFLABS
🧠Free Forex, Crypto & Stock Trading tutorial, same as ICT, Smart Money & Price Action:
tradingfinder.com/education/forex/
免责声明
这些信息和出版物并非旨在提供,也不构成TradingView提供或认可的任何形式的财务、投资、交易或其他类型的建议或推荐。请阅读使用条款了解更多信息。